


How do you interpret a load-settlement curve?
To interpret a load-settlement curve, plot the applied load on the vertical axis against the measured pile head displacement on the horizontal axis. The shape of the curve tells you how the pile transfers load to the surrounding soil, where resistance is mobilized, and whether the pile has reached its ultimate bearing capacity during the test.
Static load testing produces this curve directly from load cell and displacement gauge readings, making it one of the most reliable tools in foundation engineering. The sections below answer the most common questions engineers ask when reading and applying load-settlement data.
What does a load-settlement curve actually show?
A load-settlement curve shows the relationship between the load applied to a pile head and the resulting vertical displacement at that point. It reveals how the pile stiffens or softens under increasing load, how much of the displacement is elastic versus permanent, and whether the pile has mobilized its full resistance capacity during the test.
In practical terms, the curve captures two types of behavior simultaneously. The elastic component of settlement recovers when the load is removed. The plastic component remains as permanent displacement. By applying and then removing load in increments, you can separate these two contributions and understand how the pile will behave under working conditions over time.
The curve also reflects the load transfer mechanism. A pile that relies primarily on shaft friction will begin to settle gradually from the first load increment, as friction is mobilized progressively along the shaft. A pile that relies on end bearing will show relatively small settlements until the toe resistance is engaged, at which point the curve steepens. Many piles combine both mechanisms, and the curve shape reflects that combination.
In fine-grained cohesive soils, the curve also captures time-dependent behavior. Sustained load increments held for defined periods reveal creep and consolidation effects that no other testing method can replicate directly.
How do you identify the failure load on a load-settlement curve?
The failure load on a load-settlement curve is identified as the point at which settlement increases rapidly without a proportional increase in applied load. This is sometimes called the plunging failure point, where the curve bends sharply and displacement accelerates. When the curve does not reach a clear plunge, engineers apply an interpretation criterion to define failure from the available data.
Several widely used criteria exist for defining failure load when the curve does not plunge clearly:
- Davisson’s criterion: Failure is defined at the load where settlement equals the elastic compression of the pile plus a fixed offset. This method is common in North American practice and is well-suited to driven piles.
- The 10% diameter criterion: Failure is taken at the load producing a settlement equal to 10% of the pile diameter. This is frequently used in European practice and is referenced in several national standards.
- The slope tangent method: Failure is defined where the slope of the load-settlement curve reaches a defined threshold, indicating that incremental load produces disproportionate settlement.
- The limit load from a log-log plot: Plotting load and settlement on logarithmic axes can reveal a bilinear relationship, with the break point indicating the onset of failure.
The choice of criterion matters because different methods can produce different failure load values from the same curve. Your project specification, applicable design code, and pile type should guide which criterion you apply. Always document the method used so that results are comparable across piles and projects.
What causes a load-settlement curve to look non-linear?
A load-settlement curve looks non-linear because soil is not a linear elastic material. As load increases, soil stiffness decreases, friction along the pile shaft progressively mobilizes and eventually reaches its limit, and the pile-soil system transitions from elastic to plastic behavior. Non-linearity is therefore normal and expected in any real pile load test.
Several specific factors drive the degree and shape of non-linearity:
- Shaft friction mobilization: Friction resistance along the pile shaft reaches its peak at relatively small displacements, often just a few millimeters. Once mobilized, further load must be carried by the toe, causing the curve to steepen.
- Toe resistance engagement: End bearing typically requires larger displacements to mobilize fully. As the toe engages, the curve may flatten slightly before steepening again near failure.
- Soil type and stiffness: Dense granular soils produce stiffer, more linear curves at working loads. Soft clays produce more gradual, curved responses with significant time-dependent settlement under sustained load.
- Pile geometry: Long slender piles compress elastically under load, contributing to measured settlement before any soil yielding occurs. This elastic compression is recoverable and must be accounted for when interpreting the curve.
- Installation effects: Driven piles compact surrounding soil and may generate excess pore pressures that dissipate over time. Bored piles may disturb soil near the toe. Both effects influence the shape of the curve.
A sudden change in slope, sometimes called a kink in the curve, can indicate a specific event such as the full mobilization of shaft friction, the onset of toe resistance, or, in some cases, a structural issue with the pile itself. Identifying these kinks and understanding what drives them is a core part of curve interpretation.
What’s the difference between a stiff curve and a plunging curve?
A stiff load-settlement curve shows small, proportional settlements across a wide range of applied loads, indicating that the pile has significant reserve capacity beyond the tested load. A plunging curve shows settlements that accelerate sharply at a specific load level, indicating that the pile has reached or is close to its ultimate bearing capacity. The two curve shapes reflect fundamentally different pile-soil behavior and carry different implications for design.
Stiff curves and what they indicate
A stiff curve typically occurs when the pile is loaded well below its ultimate capacity, when the pile relies heavily on end bearing in a dense or hard material, or when the pile is short and stocky relative to the applied load. The curve remains nearly linear through the test range, and settlements remain small and largely elastic. If the test is terminated before the curve shows any sign of yielding, you cannot determine the failure load from the data alone and must rely on an interpretation criterion or additional testing.
Stiff curves are common in tests on end-bearing piles founded in rock or dense gravel, and in situations where the test load is limited by the reaction system rather than by pile capacity. While a stiff curve confirms adequate performance at the tested load, it does not tell you how much reserve capacity exists above that level.
Plunging curves and what they indicate
A plunging curve occurs when the applied load reaches the ultimate resistance of the pile-soil system. Settlement accelerates rapidly, and the pile continues to displace without a significant increase in load. This is the clearest and most unambiguous form of failure in a pile load test, and it allows direct identification of the ultimate bearing capacity without relying on an interpretation criterion.
Plunging behavior is more common in friction piles in soft to medium soils, in piles with limited toe resistance, and in tests designed specifically to load the pile to failure. Reaching plunging failure during a test is valuable because it removes uncertainty from the capacity determination, but it requires a reaction system capable of delivering loads well above the expected working load.
How do you determine the allowable pile capacity from the curve?
You determine the allowable pile capacity by first identifying the failure load from the curve using an appropriate criterion, then dividing that value by a safety factor, or by applying a resistance factor if your design code uses a limit state approach. The result is the load the pile can carry in service while maintaining an acceptable margin against failure and limiting settlement to tolerable levels.
The process involves two parallel checks:
- Capacity check: Apply the relevant failure criterion to identify the ultimate load. Divide by the global safety factor specified in your design code, or apply the appropriate partial resistance factor. Typical global safety factors for pile foundations range from 2.0 to 2.5, depending on the number of tests performed, the variability of results, and the consequences of failure.
- Settlement check: Read the settlement at the proposed working load directly from the curve. Confirm that this settlement falls within the limits set by the structural design. For many structures, settlement tolerance governs the allowable load rather than the capacity margin.
The load-settlement curve is particularly useful for the settlement check because it provides a direct, measured displacement at any load level within the tested range. This is something that dynamic testing cannot replicate, since dynamic methods apply loads lasting only milliseconds and cannot capture the sustained, time-dependent displacement behavior that governs serviceability in many projects.
When multiple piles are tested on the same project, compare the curves to assess variability across the foundation group. Significant differences in stiffness or capacity between piles of the same type and length may indicate installation quality issues or unexpected soil variability that warrants further investigation.
When should a load-settlement curve be verified with additional testing?
A load-settlement curve should be verified with additional testing when the curve does not reach a clear failure point, when results show unexpected variability across the pile group, when the soil profile includes cohesive layers where time-dependent behavior is significant, or when the project involves high-consequence foundations where the cost of failure far exceeds the cost of additional testing.
Specific situations that call for supplementary testing include:
- Inconclusive failure load: If the test was terminated before the curve showed yielding, the ultimate capacity is unknown. A follow-up test with higher load capacity, or a different test method, may be needed to establish the actual failure load.
- Unexpected curve shape: A kink, sudden stiffening, or irregular settlement pattern may indicate a structural defect in the pile, unexpected soil layering, or an instrumentation issue. Pile integrity testing can help distinguish between structural and soil-related causes.
- High variability between piles: If curves from nominally identical piles differ significantly in stiffness or capacity, the cause needs to be understood before the full foundation program proceeds.
- Cohesive soil profiles: In soft clays and silts, pore pressures generated during installation take time to dissipate. Testing too soon after installation can underestimate long-term capacity. A retest after an adequate waiting period, or supplementary monitoring under sustained load, provides more reliable data.
- Regulatory or contractual requirements: Some projects require independent verification of pile capacity by a second method. In these cases, combining static load testing with dynamic testing or Rapid Load Testing on a subset of piles provides a cross-check that satisfies both technical and contractual requirements.
- Offshore and high-consequence applications: Where remediation after installation is costly or technically impractical, the value of additional testing before committing to the full foundation program is high. Identifying a capacity shortfall at the testing stage is far more manageable than discovering it after the superstructure is in place.
How Allnamics Helps You Interpret and Verify Pile Load Test Results
We work with project teams at every stage of pile load testing, from test design and execution through to curve interpretation, capacity determination, and recommendations for follow-up action. Our involvement covers both the technical and practical dimensions of getting reliable, actionable results from your pile load tests.
Here is what we bring to your project:
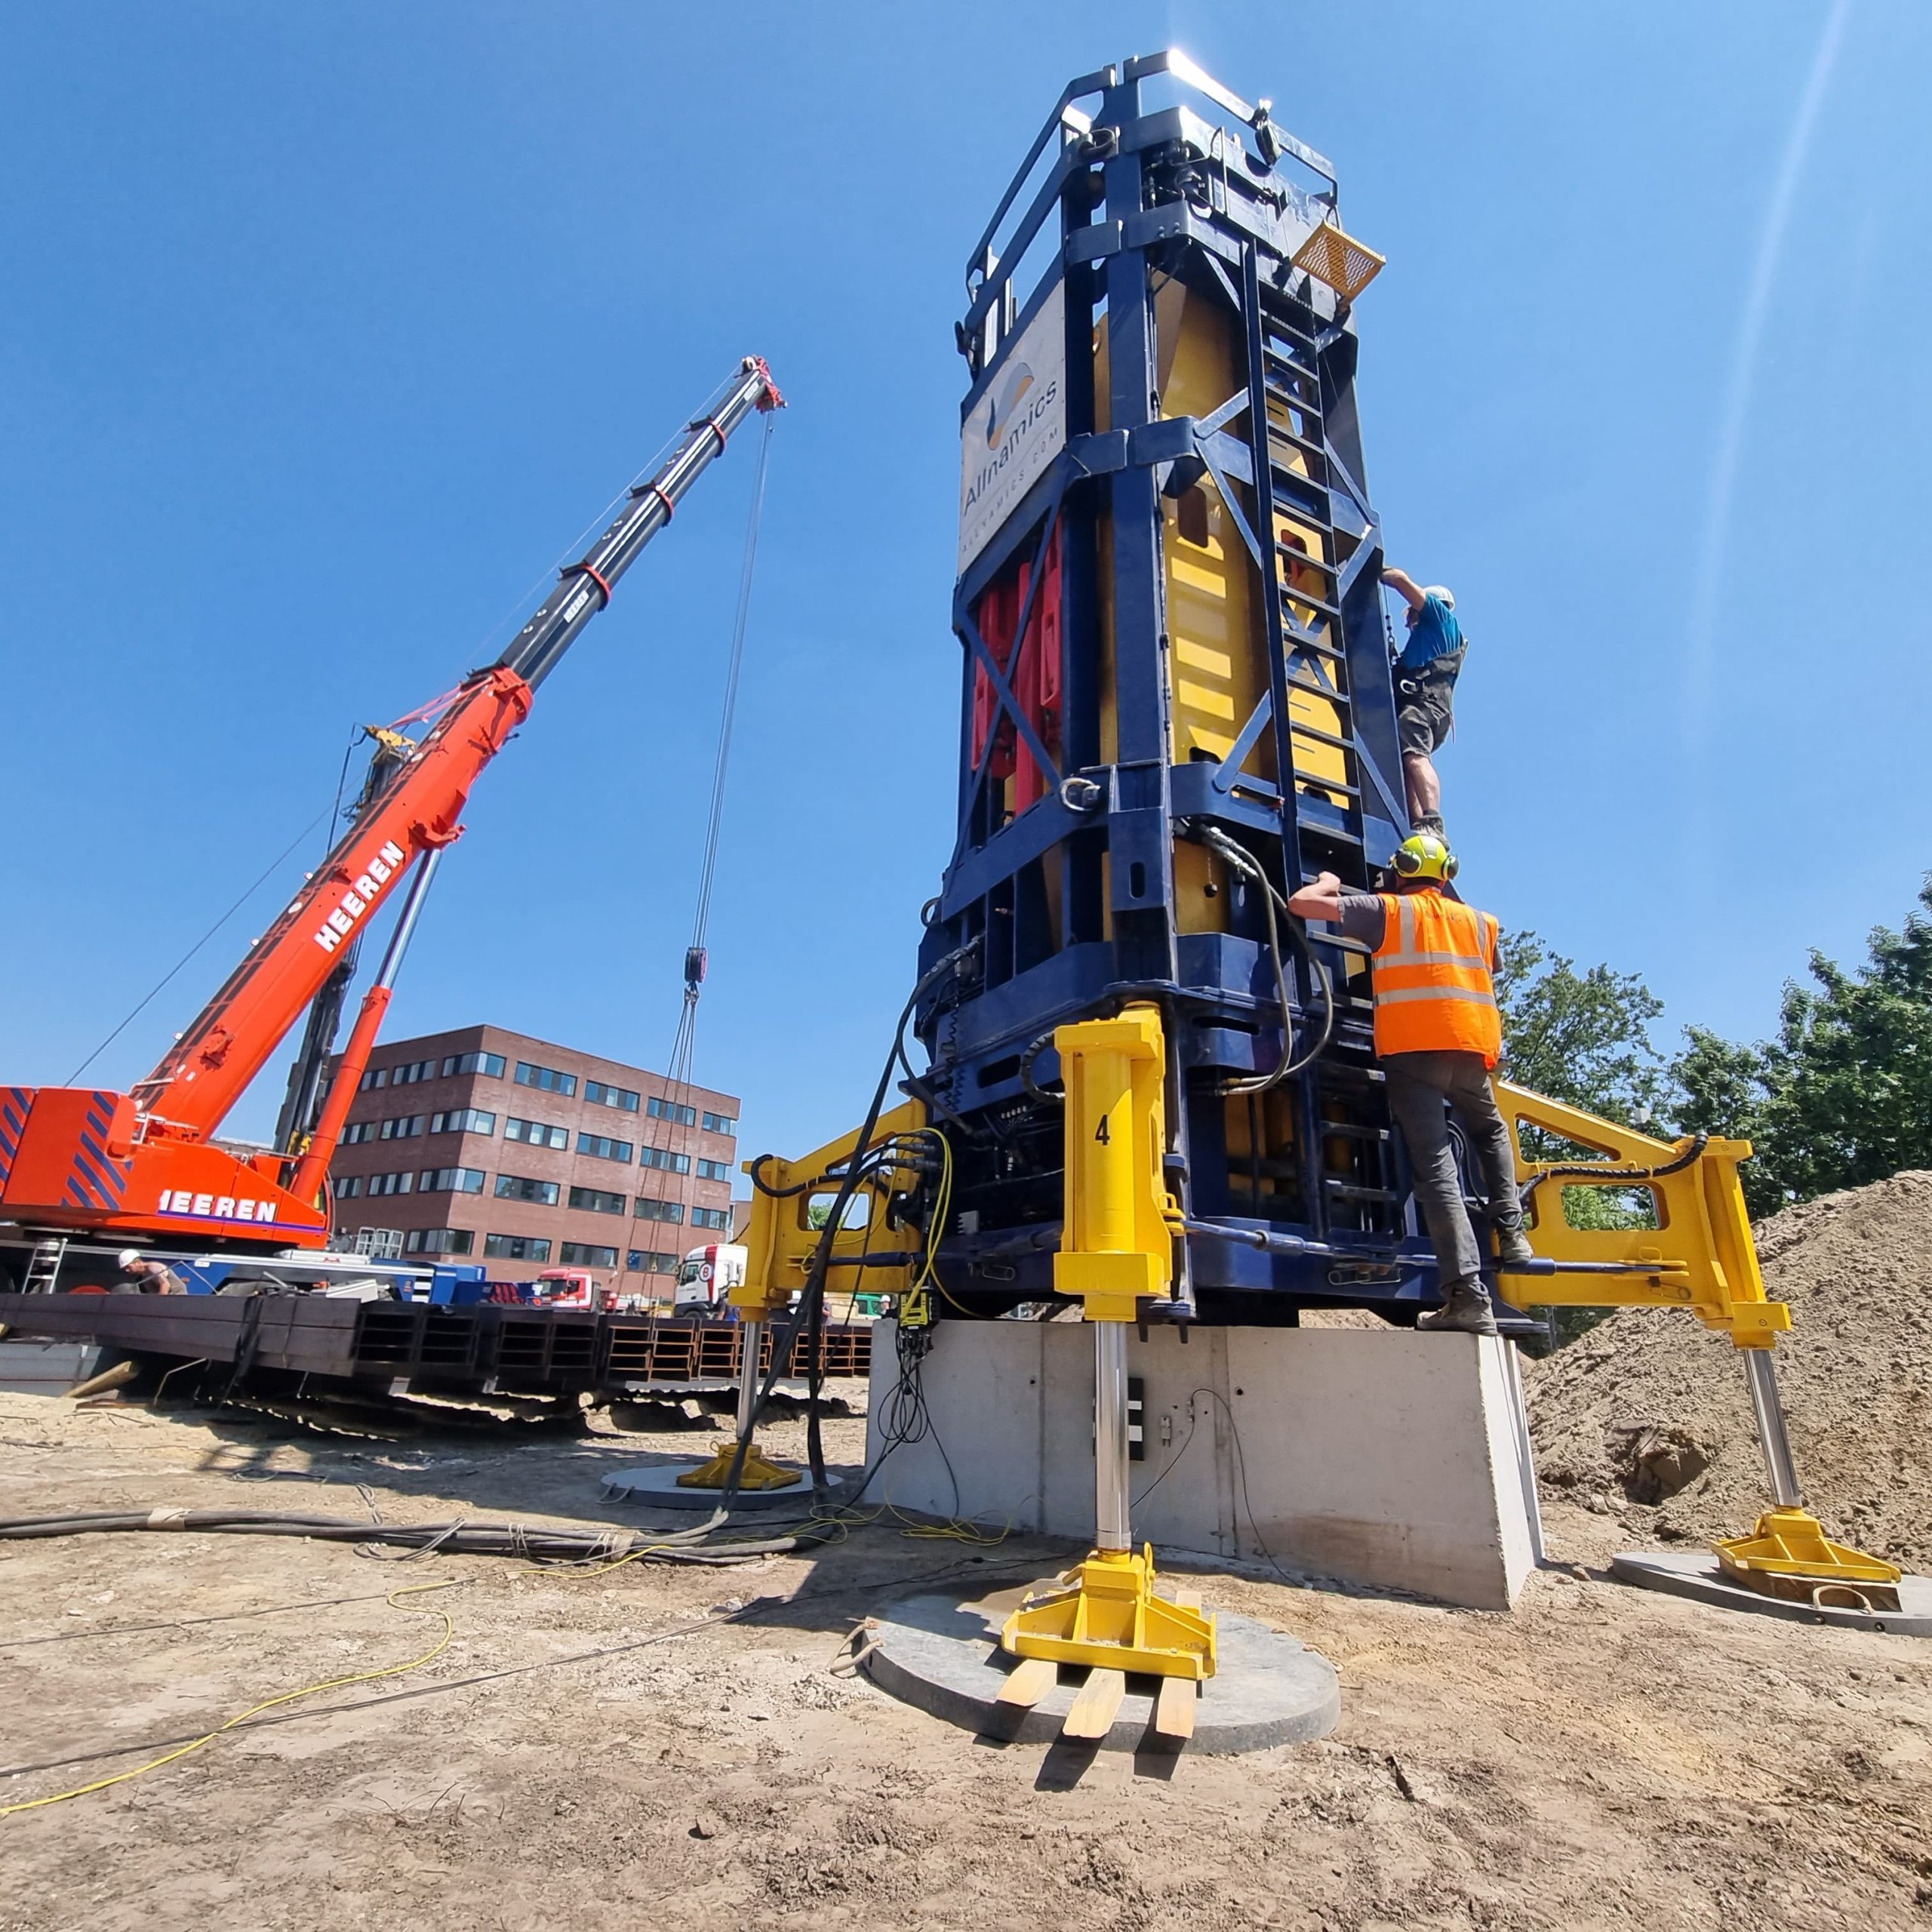
- Static Load Testing (SLT): We design and perform compression and tension tests, vertical and horizontal, using dedicated equipment that delivers high-quality load and settlement readings. The resulting load-settlement curve is direct, unambiguous, and ready for interpretation without additional modeling.
- Rapid Load Testing (RLT) with StatRapid or Statnamic: Where static testing is logistically constrained, our Rapid Load Testing methods apply a controlled impulse load over a duration long enough to eliminate stress wave effects, producing results that are significantly more accurate than dynamic testing alone and directly comparable to static test data.
- Dynamic Load Testing with signal matching: For driven pile programs where speed and coverage matter, we perform Dynamic Load Testing using our own PDA system and interpret results using AllWave-DLT software. Signal matching is always performed by experienced engineers, not automated routines, which keeps the bandwidth of outcomes as narrow as possible.
- Combined test programs: We regularly design programs that combine static or Rapid Load Testing on trial piles with dynamic testing for broader quality control across the production program, giving you both the depth of a full load-settlement curve and the efficiency of high-volume testing.
- Independent interpretation and review: If your team has existing test data and needs an independent assessment of the load-settlement curve, failure load determination, or capacity derivation, we provide that review as a standalone service.
If you are planning a pile load test program or need support interpreting existing results, contact our team to discuss your project requirements and find the right approach for your foundation conditions.
Related Articles
- What challenges does saltwater exposure create for testing equipment?
- How is pile testing data used to optimise foundation design?
- What is a maintained load test and when is it used?
- Why is pile load testing required for offshore wind installations?
- How does a constant rate of penetration test work?
This content was generated with the help of AI — it may contain mistakes