In April 2016 Allnamics performed PDA-monitoring and DLT-testing for our client Voorbij Funderingstechniek BV, for the Amstel Towers Hotel near the Amstel station in Amsterdam. The tests were done on 51 m long precast concrete piles, driven in sections with a mechanical joint.
Pile Driving Analysis (PDA) was done during the entire installation of selected production piles. The main goal was to check the tensile stresses during driving, in particular at the location of the mechanical joint.
Dynamic Load Testing (DLT) was done during restrike (approx. 10 blows) on piles that had been installed a couple of days earlier. The main goals of these tests were to check the stresses in the pile shaft and the joint as well as the static bearing capacity of the pile.
Both PDA and DLT used the in-house developed Allnamics PDR-system, fitted with combined strain and acceleration sensors, that were mounted near the pile head. The PDR reads and stores the monitoring data in real time and transmits them through a wireless connection (using Wi-Fi) to the field computer of the monitoring engineer. The wireless connection offers great advantages during upending and positioning of the pile, and makes it possible for the monitoring engineer to do his monitoring job from a location at a safe distance from the pile, without traditional worries about the long cable getting stuck or damaged during handling or pile driving.

Photo 1 : no trouble with long cables during upending of the pile.
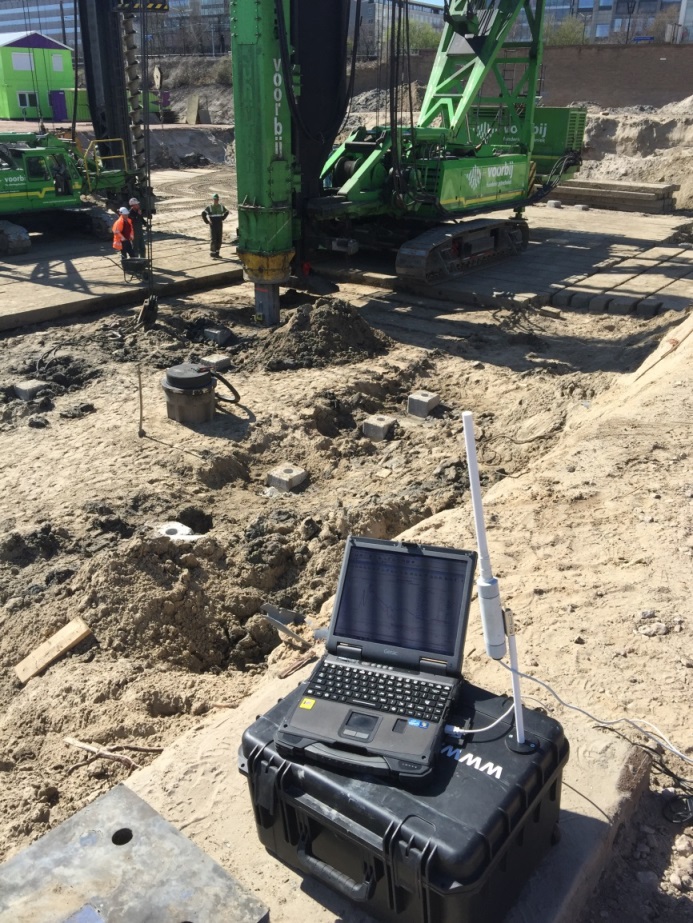
Photo 2 : Monitoring with WiFi connection, at a safe distance from the pile.
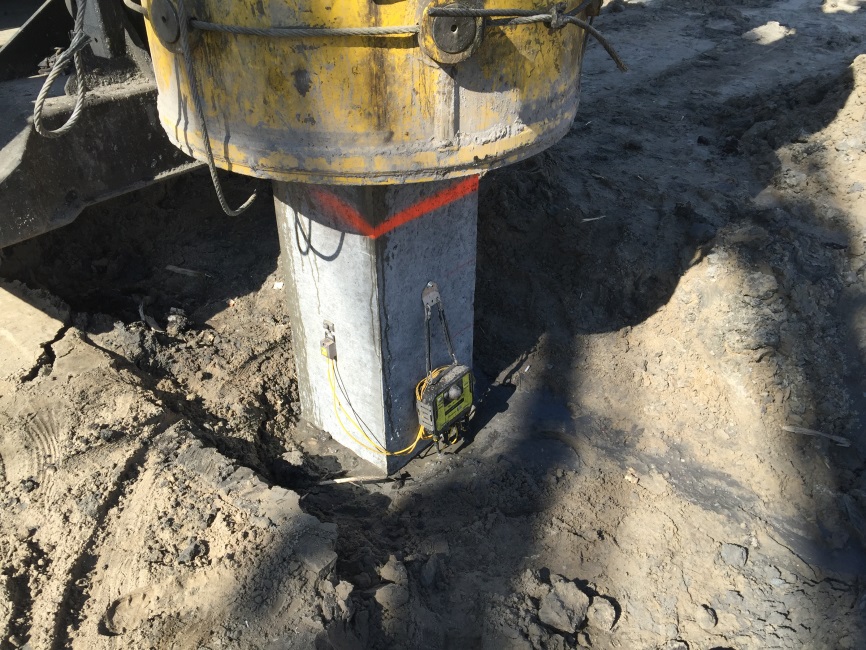
Photo 3 : pile and monitoring equipment at end of PDA
The tests showed that the tension stresses during driving were acceptable and that the available static bearing capacity is sufficient for the design loads of the piles.
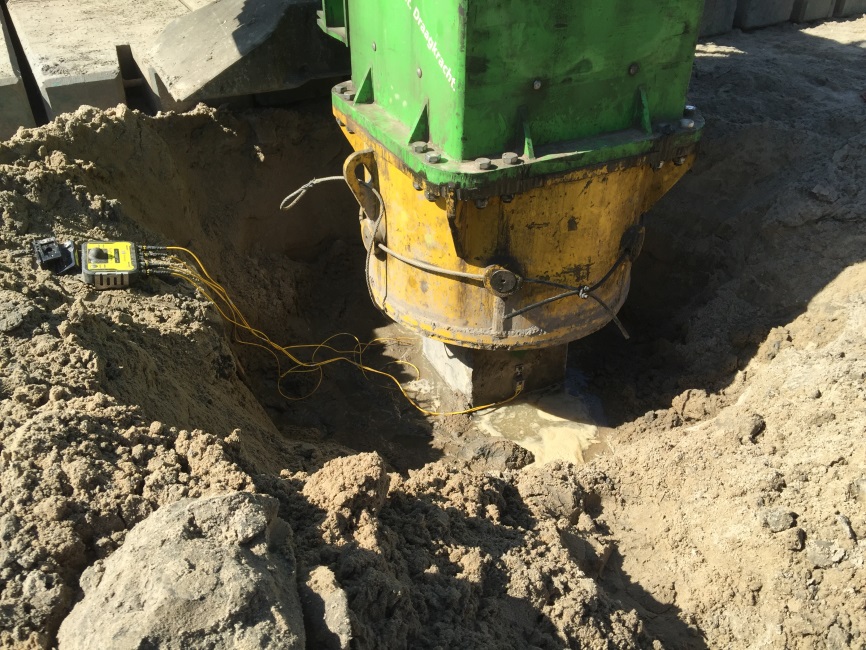
Photo 4 : DLT (Dynamic Load Test) during restrike on a previously installed pile.

The measurements were carried out with Allnamics-PDA/DLT software.
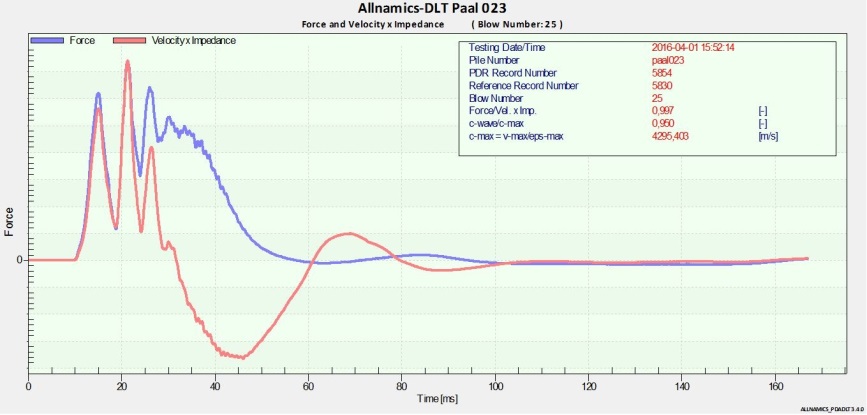
Graph 1 : measured force vs. velocity * impedance (F vs. Z*v)
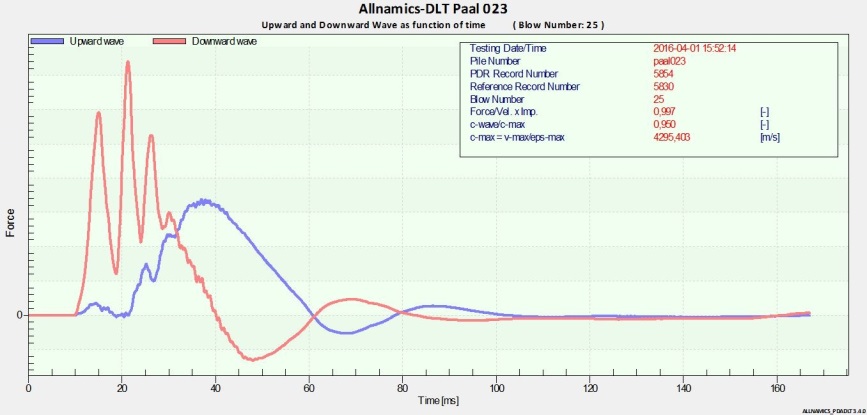
Graph 2 : measured total force separated in downward force wave and upward force wave
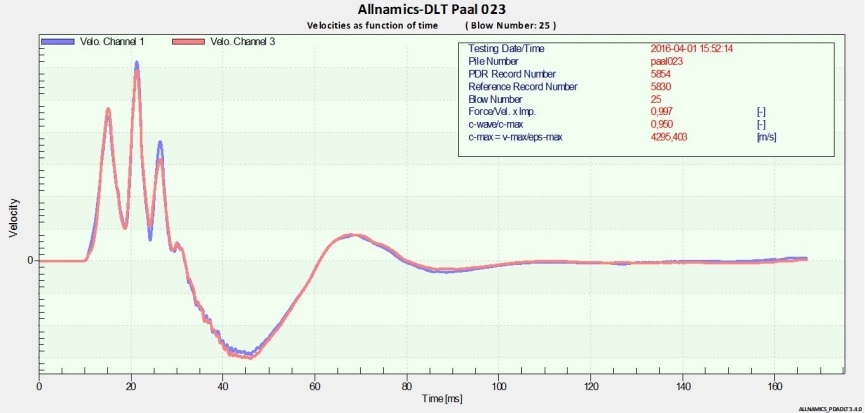
Graph 3 : measured acceleration converted to velocities by integration in time
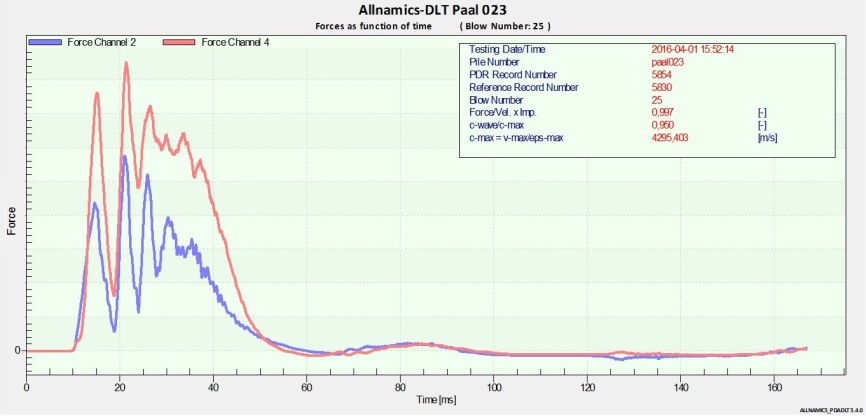
Graph 4 : measured strains, converted to force by multiplying with stiffness EA. The difference indicates the eccentricity of the hammer blow
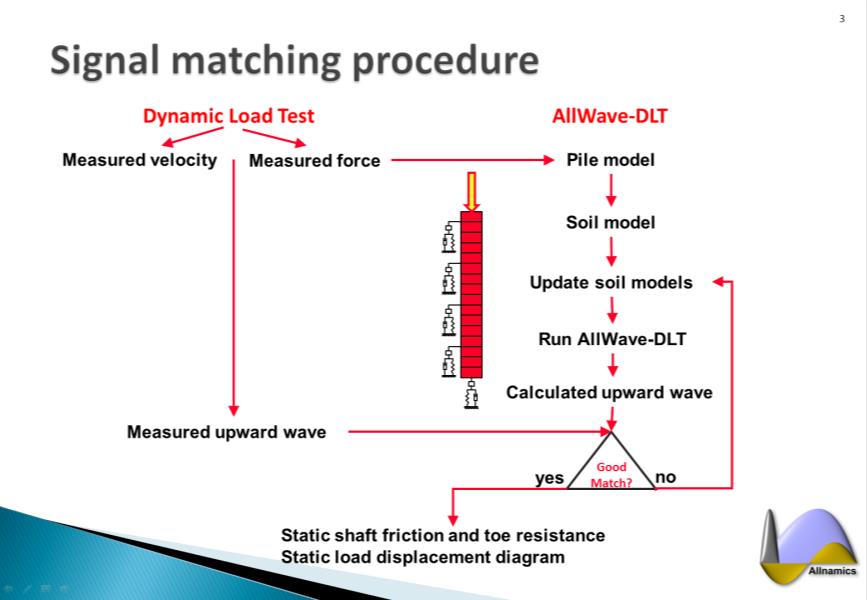
Analysis has been done with the signal matching program AllWave-DLT.

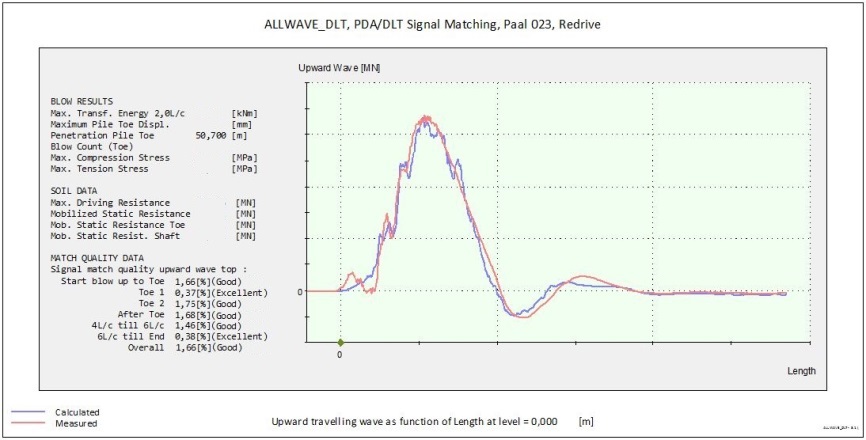
Graph 5 : measured vs. calculated upward force wave (Fup).
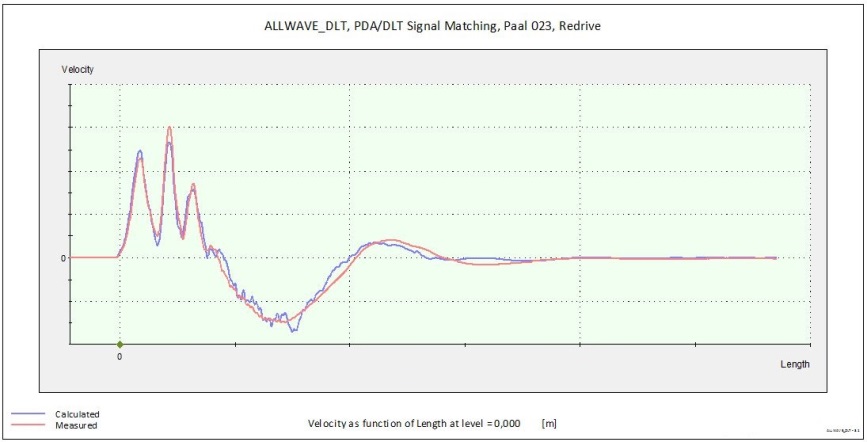
Graph 6 : measured vs. calculated velocity
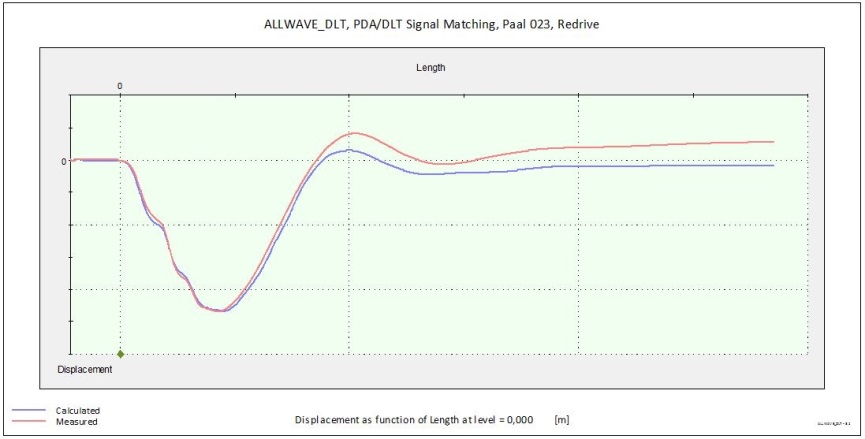
Graph 7 : measured vs. calculated displacement
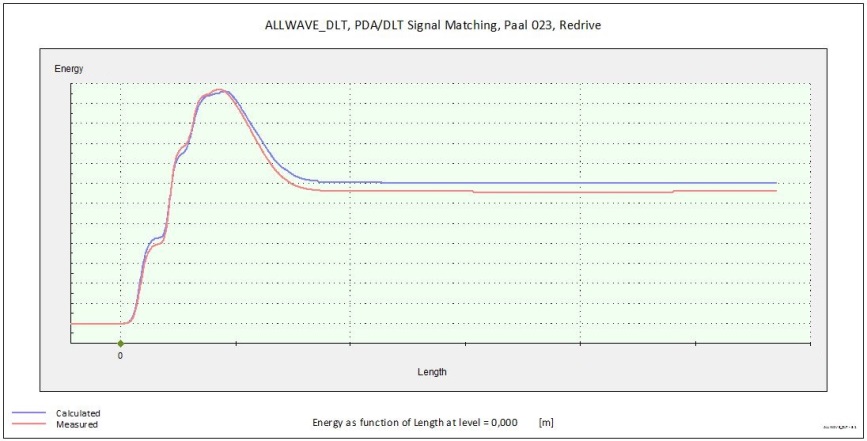
Graph 8 : measured vs. calculated transferred energy
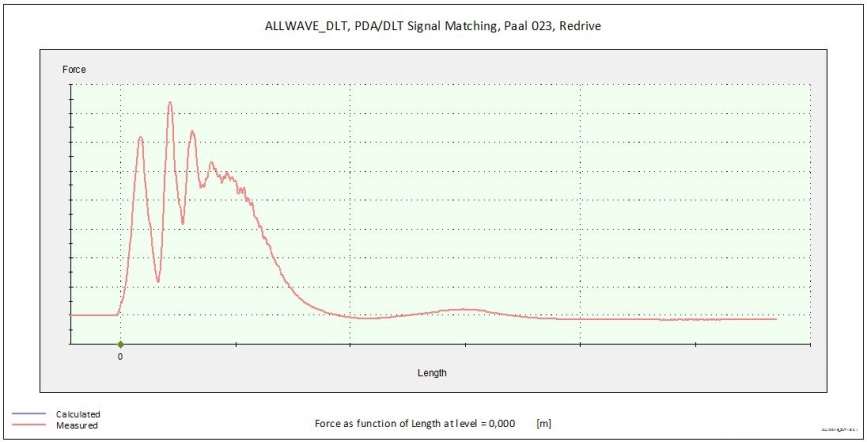
Graph 9 : measured vs. calculated force
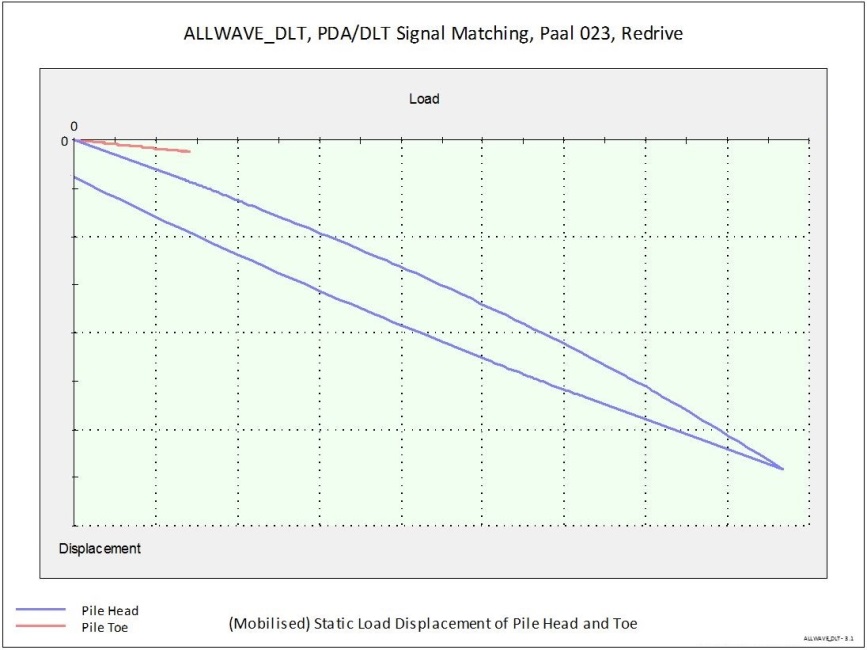
Graph 10 : diagram mobilized load-displacement.
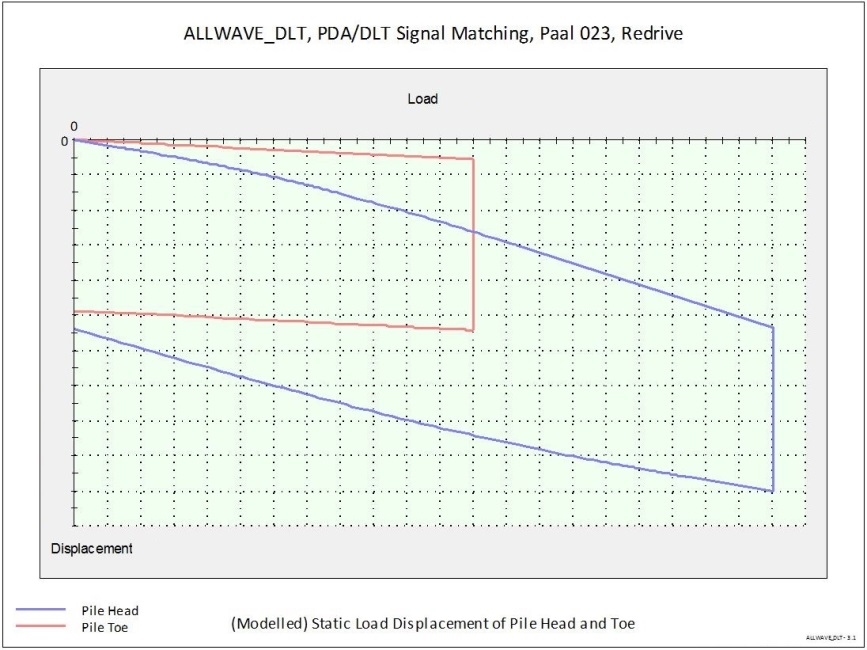
Graph 11 : diagram modelled load-displacement
Do you want to know more about dynamic measurement during pile-driving or determining the load capacity from dynamic measurements? Then contact us.