

How can the Allnamics Learning Loop improve future Drivability Predictions?
The Allnamics Learning Loop improves future drivability predictions by systematically feeding real installation data back into the soil model after each project. Measured blow counts, dynamic monitoring signals, and signal matching results replace initial assumptions with field-verified parameters, making every subsequent prediction more accurate. The sections below unpack each part of that cycle in detail.
What data does the Allnamics Learning Loop feed back into drivability models?
The Learning Loop feeds back four main categories of data: measured blow counts and penetration rates from the actual installation, dynamic monitoring signals recorded during driving, signal matching results that reveal true soil resistance, and hammer performance data that shows how efficiently energy was transferred into the pile. Together, these replace the assumptions that the original model had to make before any pile was driven.
Before installation begins, a drivability model relies on interpreted ground investigation data: CPT profiles, borehole logs, and engineering judgement about dynamic soil parameters such as shaft and toe resistance, damping, and friction fatigue. These inputs carry uncertainty. Once a pile is installed and monitored, that uncertainty becomes measurable. The gap between predicted blow count and observed blow count at each depth tells you exactly where the soil model was strong and where it was not.
Signal matching, or back-analysis, goes further. By fitting a stress-wave model to the measured force and velocity signals at the pile head, you can derive a soil resistance profile that reflects what the ground actually did during driving, not what a CPT interpretation suggested it would do. That back-analysed soil model then enters an experience database. When the next pile is driven on the same site, or on a geologically similar site, the updated model becomes the starting point rather than a raw CPT interpretation.
For vibratory driving, the same principle applies. Monitoring the actual penetration rate, vibration frequency, and eccentric moment during installation, then post-processing those signals, produces a calibrated soil model for vibratory conditions that no pre-installation analysis alone can generate.
Why do drivability predictions often diverge from field results?
Drivability predictions diverge from field results primarily because the soil model is built from interpreted data, not direct measurement of dynamic behaviour. CPT and borehole data describe static soil properties, and converting those into dynamic resistance parameters (damping coefficients, quake values, friction fatigue factors) requires assumptions that may not match the specific conditions encountered during driving.
Several sources of uncertainty compound each other. Soil layer boundaries in the model may not match the actual stratigraphy at the exact pile location. Dynamic shaft and toe resistance depend on loading rate and remoulding effects that vary with pile geometry, driving energy, and the number of blows already applied. Hammer efficiency in the field often differs from the manufacturer’s rated value, particularly as equipment ages or operating conditions change. Cushion behaviour changes as it compresses and heats up during a long driving sequence.
Structural pile properties also introduce variability. Impedance changes at splices, section transitions, or damaged sections affect how stress waves travel through the pile and how energy reaches the toe. If the model does not capture these accurately, the predicted blow count will diverge from the measured one even if the soil model is reasonable.
None of these divergences are failures of the method. They are the expected result of predicting a complex physical process from indirect data. The important point is that a divergence carries information. A prediction that is systematically too optimistic in a particular soil type, or with a particular hammer, tells you something specific about which model parameter needs adjustment. That is precisely what the Learning Loop is designed to capture.
How does real-time pile monitoring improve prediction accuracy over time?
Real-time pile monitoring improves prediction accuracy by converting each installation into a calibration experiment. When sensors at the pile head record force and velocity signals blow by blow, you collect a continuous record of how the hammer, pile, and soil interacted throughout the entire driving sequence, data that no pre-installation analysis can produce.
During driving, monitoring allows your team to compare observed blow counts against the predicted blow count profile in real time. If the pile meets higher resistance than expected at a particular depth, you can identify whether that reflects a soil layer boundary that was not resolved in the CPT, a drop in hammer efficiency, or a change in soil behaviour due to remoulding. That distinction matters because the correct response (adjusting hammer settings, pausing for set-up, or revising the installation plan) depends on understanding the cause.
After installation, the recorded signals feed directly into signal matching. The back-analysed soil resistance profile, combined with the measured hammer performance data, produces an updated soil model that reflects actual field conditions. When this updated model is stored in an experience database alongside the original prediction and the site’s ground investigation data, it becomes a reference for future projects in similar ground conditions.
Over multiple projects, this process builds a body of calibrated soil models that progressively reduces the uncertainty range in new predictions. Sensitivity analyses on future projects can be anchored to realistic parameter ranges drawn from monitored installations rather than purely theoretical estimates. The result is not just a more accurate blow count prediction; it is a more reliable assessment of installation risk, pile stress levels, and the likelihood of early refusal.
What role does the AllWave software play in the Learning Loop?
The AllWave software package is the computational engine that runs at every stage of the Learning Loop. It performs the initial drivability prediction, simulates stress wave propagation during driving, supports real-time signal matching during installation monitoring, and enables the post-analysis that updates the soil model after driving is complete.
AllWave-PDP (Pile Driving Prediction) handles impact driving simulations. It models the coupled interaction between hammer, cushion system, pile, and soil for each blow at each penetration level, producing blow count profiles, pile stress envelopes, energy transfer curves, and penetration resistance as a function of depth. Sensitivity analyses within AllWave-PDP allow you to test how the prediction changes when key soil or hammer parameters vary, making the uncertainty in the prediction explicit rather than hidden.
AllWave-VDP (Vibratory Driving Prediction) applies the same stress-wave framework to vibratory installation. It simulates penetration rate, eccentric moment, and soil resistance for vibratory hammers, and supports post-analysis of monitored vibratory installations. Because vibratory driving behaviour is particularly sensitive to soil model assumptions, the feedback loop between AllWave-VDP predictions and monitored field data is especially valuable for improving future vibratory drivability predictions.
AllWave-DLT supports Dynamic Load Testing and signal matching, which is the back-analysis step that extracts a calibrated soil resistance profile from measured pile head signals. The soil model derived through AllWave-DLT signal matching is directly comparable to the soil model used in the original AllWave-PDP or AllWave-VDP prediction, which makes the comparison between prediction and reality technically consistent and actionable.
Together, these tools implement what the AllWave-PDP manual describes as the core workflow: ground investigation, initial soil model, drivability prediction, installation monitoring, signal matching and back-analysis, updated soil model, comparison with prediction, experience database, and improved next prediction.
Which project types benefit most from a Learning Loop approach?
Projects with multiple piles in variable or uncertain ground conditions benefit most from a Learning Loop approach, because the calibration value of early monitored installations compounds across the remaining programme. Offshore wind foundations, large infrastructure projects, and port developments (where dozens or hundreds of piles are driven in similar but not identical ground) are the clearest examples.
Offshore wind projects are a strong case. Monopile installation in heterogeneous seabed conditions involves significant uncertainty in dynamic soil parameters, particularly in chalk, dense sands, or layered profiles where friction fatigue and plug behaviour are difficult to predict from CPT data alone. Monitoring the first few installations and feeding the back-analysed soil models into updated predictions for the remaining foundations can reduce the risk of early refusal, over-driving, or structural overstress across the entire turbine array.
Projects involving vibratory driving benefit particularly strongly. Vibratory soil modelling carries higher inherent uncertainty than impact driving models, and the relationship between CPT-derived parameters and actual vibratory penetration resistance is less well established. Each monitored vibratory installation that feeds back into an updated AllWave-VDP model adds disproportionate value to future predictions on similar ground.
Projects in geologically complex or poorly characterised ground also gain significantly. Where ground investigation data is sparse or where the site geology is known to be variable, a single monitored installation can reveal soil behaviour that no amount of pre-installation analysis could have predicted. That information, captured and stored systematically, transforms an uncertain prediction into a calibrated one for the next pile.
Finally, repeat clients working across multiple sites in a region build a long-term advantage. An experience database populated with calibrated soil models from previous projects in similar geological settings becomes a technical asset that reduces prediction uncertainty and installation risk on every new project in that region.
How We Help You Build Better Drivability Predictions
We implement the full Learning Loop (from initial soil modelling and drivability prediction through installation monitoring, signal matching, and post-analysis) so that each project improves the accuracy of the next. Here is what that looks like in practice:
- Pre-installation drivability studies using AllWave-PDP and AllWave-VDP, with explicit sensitivity analyses that quantify the uncertainty in your blow count and stress predictions before a single pile is driven
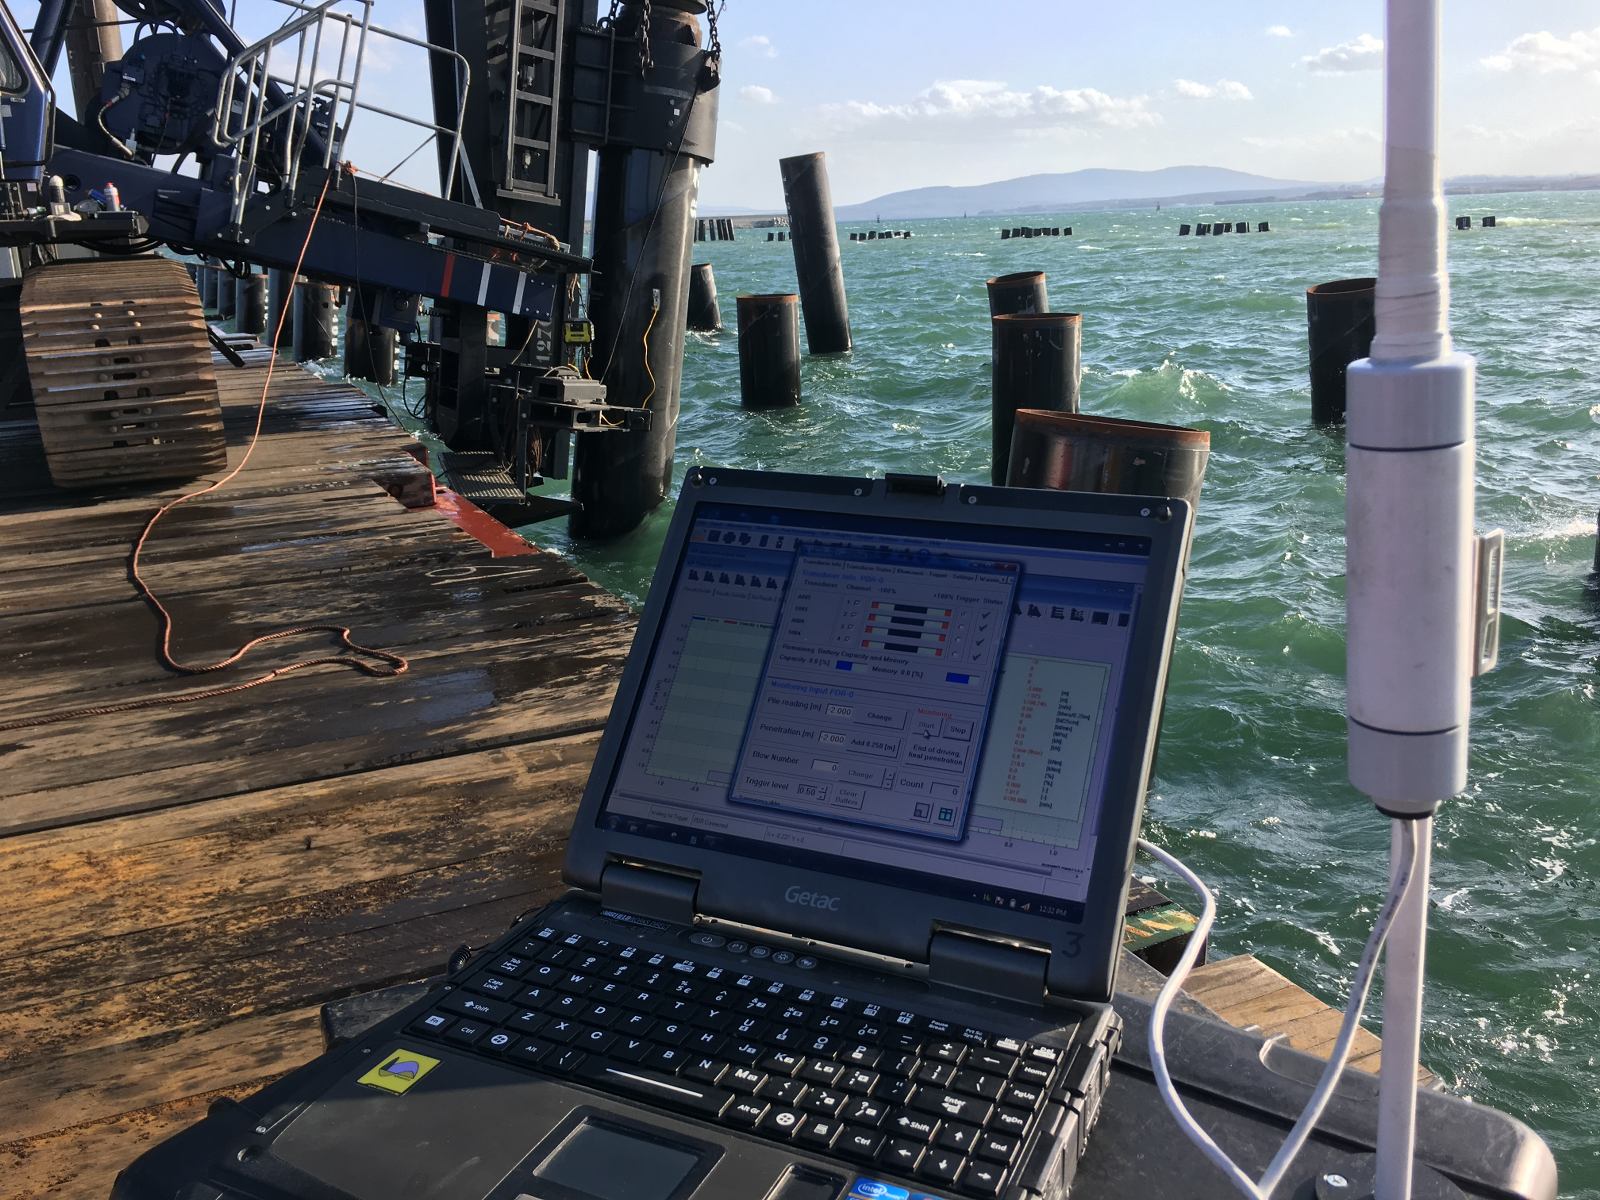
- Real-time installation monitoring with dynamic load testing equipment, capturing force and velocity signals blow by blow throughout the driving sequence
- Signal matching and back-analysis after installation, producing a calibrated soil resistance profile that directly updates the original drivability model
- Structured comparison between predicted and measured performance at each depth, identifying which model parameters drove the divergence and how to correct them
- Experience database management, storing calibrated soil models alongside site investigation data so that future predictions on similar ground start from a stronger foundation
- Vibratory driving prediction and post-analysis using AllWave-VDP, supporting the systematic monitoring and back-analysis that is the primary route to improving vibratory drivability models
If your project involves multiple piles, uncertain ground conditions, or a programme where installation risk needs to be actively managed rather than assumed away, the Learning Loop approach delivers measurable value from the first monitored pile onward. Contact us to discuss how we can apply this to your foundation programme.
Related Articles
- Why is soil damping important in a Drivability Prediction?
- How is pile fatigue calculated with AllWave-VDP?
- What are the safety requirements during a Rapid Load Test?
- What is the difference between compression and tension pile testing?
- What are the benefits of pile load testing for offshore foundations?