

How can Dynamic Load Testing be used to validate a pile driving model?
Dynamic Load Testing (DLT) validates a pile driving model by providing real field measurements of force, velocity, and energy transfer during pile installation, which you can compare directly against what the model predicted. When measured blow counts, stress levels, and soil resistance match the model’s output, you gain confidence that the model reflects actual ground conditions. When they diverge, you have clear evidence that the soil parameters, hammer efficiency assumptions, or resistance distribution need adjustment. The sections below walk through how the model works, how DLT generates the data, and what to do when predictions and measurements disagree.
What does a pile driving model actually predict?
A pile driving model predicts how a hammer, pile, and soil system will behave during every blow of installation. Using one-dimensional stress-wave analysis, the model calculates blow count versus penetration depth, maximum compressive and tensile stresses in the pile, energy transfer from hammer to pile, and the soil resistance profile that must be overcome to achieve the target penetration.
The prediction is not a single number. A well-structured driveability analysis covers the full installation sequence from first contact with the soil to final set. For each penetration level, the model simulates the coupled hammer-pile-soil response and outputs quantities such as blow rate, hammer efficiency, shaft and toe resistance, pile displacement, and stress cycles that accumulate over the entire drive. For concrete piles, stresses in reinforcement and the potential for crack development are also relevant outputs.
This means the driveability question is broader than simply asking whether a pile can reach the required depth. A complete model must simultaneously assess whether the blow count stays within a workable range, whether pile integrity is maintained throughout, whether the hammer operates within its design limits, and whether refusal risk exists at any intermediate depth. Tools such as AllWave-PDP for impact driving and AllWave-VDP for vibratory driving are built around this multi-output logic, using the Method of Characteristics to resolve the stress-wave propagation through the pile at each time step.
The soil model that feeds into the prediction draws on CPT, SPT, and laboratory data. It translates geotechnical investigation results into layer-by-layer shaft friction and toe resistance values, combined with dynamic soil parameters such as quake and damping. Because these parameters carry uncertainty, the model’s predictions are only as reliable as the soil model behind them. That is precisely why field validation through Dynamic Load Testing is so important.
How does Dynamic Load Testing generate the data needed for validation?
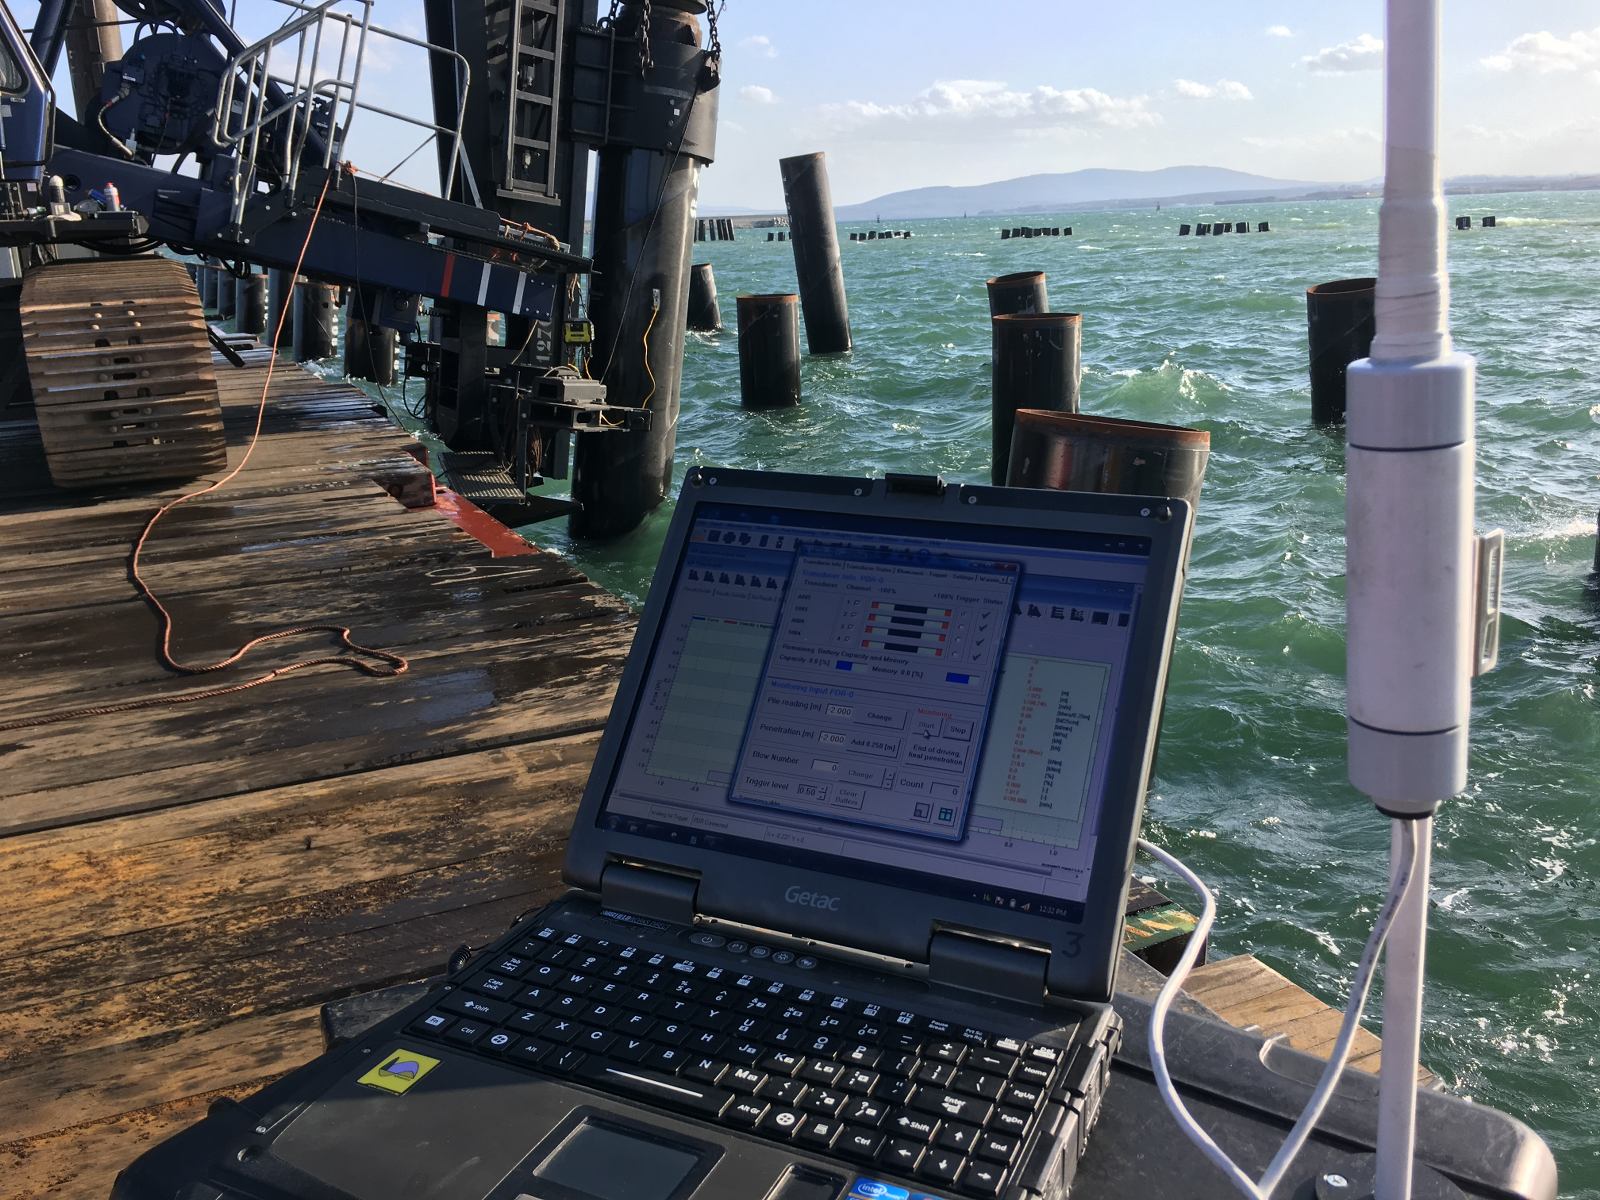
Dynamic Load Testing generates validation data by attaching strain gauges and accelerometers near the pile head during driving or restrike. These instruments record force and velocity as a function of time for each hammer blow. From these measurements, you can derive energy transfer, maximum compressive stress, set per blow, and an initial estimate of total soil resistance using methods such as the Case Method.
The raw signals capture the stress wave as it travels down the pile, interacts with the soil along the shaft and at the toe, and reflects back to the measurement point. Because the wave carries information about the resistance it encountered, the recorded signals contain a fingerprint of the soil-pile interaction during that specific blow. This is what makes DLT data so useful for model validation: it is not an indirect inference but a direct physical record of what happened inside the pile during installation.
One timing factor that significantly affects the data you collect is the gap between pile installation and the DLT measurement. Driving can generate excess pore pressures that temporarily reduce effective stress around the pile. As those pore pressures dissipate after driving stops, soil resistance increases, a phenomenon known as set-up. A DLT performed immediately at End of Driving will typically show lower ultimate resistance than a restrike test performed 24 to 48 hours later. For meaningful comparison with a driveability model, you need to record precisely when each measurement was taken relative to installation, and you need to account for set-up when interpreting the results.
What is CAPWAP and why is it central to model validation?
CAPWAP (Case Pile Wave Analysis Program) is a signal matching procedure that uses the measured force or velocity signal from a DLT as input and iteratively adjusts a pile-soil model until the computed response matches the measured one. The result is a set of static and dynamic soil parameters, including resistance distribution along the shaft and at the toe, that best explains the field measurements. Signal matching is central to model validation because it converts raw DLT signals into the same type of soil resistance parameters that your driveability model uses.
The process works by feeding one measured signal, typically velocity, into the wave equation model and computing the force response. The computed force is compared with the measured force. Soil parameters are then adjusted iteratively until the match is satisfactory. The final matched parameter set gives you a resistance profile that is grounded in actual field behavior rather than derived purely from soil investigation data.
The reliability of signal matching improves substantially when you calibrate it against a Static Load Test (SLT). In that workflow, you first perform signal matching to determine static and dynamic soil parameters. You then use the static components of the matched model to compute a load-displacement response and compare it with the static test result. Where the dynamic match allows room for adjustment, you refine the parameters to also reproduce the static response. A parameter set calibrated in this way can be applied with greater confidence to similar piles and ground conditions on the same project.
It is worth noting that signal matching has limits. Open-ended tubular piles introduce uncertainty around plugging behavior, because a pile that drives in an unplugged condition may behave differently under static loading when a soil plug forms. The matched resistance distribution may not fully capture this transition, which is one reason why combining DLT signal matching with at least one static reference test is good practice on projects where plugging is a relevant factor.
At what project stages should DLT be used to validate the model?
DLT should be used at three distinct stages: during installation of the first production piles to check whether the model’s blow count and stress predictions hold in real conditions, during restrike tests to capture set-up and confirm long-term capacity, and at any point where ground conditions deviate from what the soil model assumed. Each stage answers a different validation question.
During initial installation, the primary check is whether the predicted blow count versus depth curve matches what the driving crew observes. If the model predicted 20 blows per 250 mm at a given depth and the field shows 40, the soil resistance is higher than modeled. That discrepancy needs to be resolved before continuing with the full pile program. DLT measurements at this stage also confirm whether compressive and tensile stresses stay within the limits the structural design assumed.
Restrike testing, performed hours or days after installation, addresses a different question: what is the actual long-term resistance after pore pressure dissipation? The driveability model predicts Soil Resistance to Driving (SRD) at the moment of installation, not the final static capacity. Restrike DLT data, combined with signal matching, bridges that gap. It tells you whether the set-up behavior assumed in the model, and by extension in the capacity design, is consistent with field reality.
When site investigation data is sparse or when the pile program crosses geological boundaries, additional DLT validation at intermediate stages protects against compounding errors. A soil model built on CPT data from a limited number of boreholes carries spatial uncertainty. Validating the model at multiple locations across the site reduces the risk that a localized anomaly in ground conditions goes undetected until a pile fails to reach target penetration.
What discrepancies between DLT results and model predictions indicate?
Discrepancies between DLT results and model predictions indicate that one or more of the model’s input assumptions do not match field reality. The nature of the discrepancy points to where the problem lies: blow count errors suggest the soil resistance model is wrong, stress discrepancies suggest the hammer or pile model is wrong, and energy transfer differences suggest the hammer efficiency or cushion model needs revision.
A higher-than-predicted blow count at a given depth means the model underestimated soil resistance. This could reflect an overly optimistic SRD calculation, friction fatigue effects that were not adequately modeled, or a soil layer that is stiffer than the CPT interpretation suggested. A lower-than-predicted blow count, by contrast, may indicate that the model overestimated resistance, which could lead to concerns about whether the pile will achieve the required capacity.
Stress discrepancies carry structural implications. If measured compressive stresses exceed what the model predicted, the pile is experiencing higher loading than the design assumed. For concrete piles, this can mean crack risk. For steel piles, it affects fatigue life calculations. Tensile stresses above predicted levels are particularly important for driven concrete piles, where tension capacity is limited by reinforcement and prestress.
Energy transfer differences point to the hammer-pile interface. If the energy reaching the pile is consistently lower than modeled, the hammer efficiency assumption is too optimistic, the cushion model is incorrect, or there is a mechanical issue with the hammer itself. Identifying this early prevents you from drawing wrong conclusions about soil resistance from blow count data alone, because a less efficient hammer will produce a higher blow count even if the soil resistance matches the model perfectly.
How does DLT-based validation reduce risk on large foundation projects?
DLT-based validation reduces risk on large foundation projects by catching model errors early, when corrective action is still practical and inexpensive. On a project with hundreds of piles, a systematic error in the soil model or hammer efficiency assumption propagates across the entire pile program. Identifying and correcting that error after testing the first few piles prevents it from affecting every subsequent pile.
The risk reduction operates on several levels. At the structural level, confirmed stress measurements give you evidence that pile integrity is maintained throughout installation, reducing the probability of undetected damage. At the geotechnical level, validated resistance distributions give the design team confidence that capacity predictions are grounded in field behavior rather than desk-based soil models alone. At the program management level, validated blow count predictions allow the installation contractor to plan equipment, time, and logistics with greater certainty.
For offshore wind, oil and gas, and large marine infrastructure projects, where mobilizing equipment is expensive and schedule delays carry significant cost, this early validation is particularly valuable. A driveability model that has been calibrated against DLT data from the first installed piles gives you a defensible basis for decisions about hammer selection, installation criteria, and acceptance of piles that deviate from the predicted installation curve.
Sensitivity analyses built into the driveability model also benefit from DLT validation. Before installation, you can run the model across a range of soil resistance assumptions to identify which parameters most strongly affect blow count and stress outcomes. After DLT validation, you can narrow that uncertainty range, making subsequent sensitivity analyses more meaningful and the overall risk assessment more credible.
How Allnamics Supports Pile Driving Model Validation
We combine driveability prediction, Dynamic Load Testing, and signal matching into an integrated validation workflow. Rather than treating these as separate services, we connect them so that the output of each step directly informs the next.
- Driveability prediction using AllWave-PDP and AllWave-VDP: We build hammer-pile-soil models for both impact and vibratory installation, generating blow count profiles, stress envelopes, and energy transfer predictions before a single pile is driven.
- Dynamic Load Testing during installation and restrike: Our engineers instrument piles and collect force and velocity data during driving and restrike, capturing the field behavior that the model needs to be validated against.
- Signal matching and parameter calibration: We perform signal matching to extract soil resistance distributions from DLT data, and where a Static Load Test is available, we calibrate the matched parameters against the static response to improve reliability.
- Discrepancy analysis and model updating: When DLT results diverge from predictions, we identify the source, whether it is the soil model, hammer efficiency, or pile model, and update the driveability analysis so the revised model reflects actual field conditions.
- Sensitivity analyses for risk quantification: We run parametric studies around validated soil parameters to define the realistic range of outcomes for the remaining pile program, giving your team a clear picture of residual uncertainty.
If your project involves a large pile program where model reliability directly affects schedule, cost, or structural safety, contact us to discuss how we can structure a validation program that fits your installation sequence and project timeline.