

What is signal matching and how can it improve a Drivability Prediction?
Signal matching is a technique used in pile analysis to calibrate a wave-equation soil model by iteratively adjusting soil parameters until a calculated pile response matches field measurements taken during driving or testing. When applied to a drivability study, it transforms raw installation data into a validated soil model that makes future predictions significantly more reliable. The sections below walk through how the method works, what it extracts, and where it fits within a complete drivability workflow.
How does signal matching actually work in pile analysis?
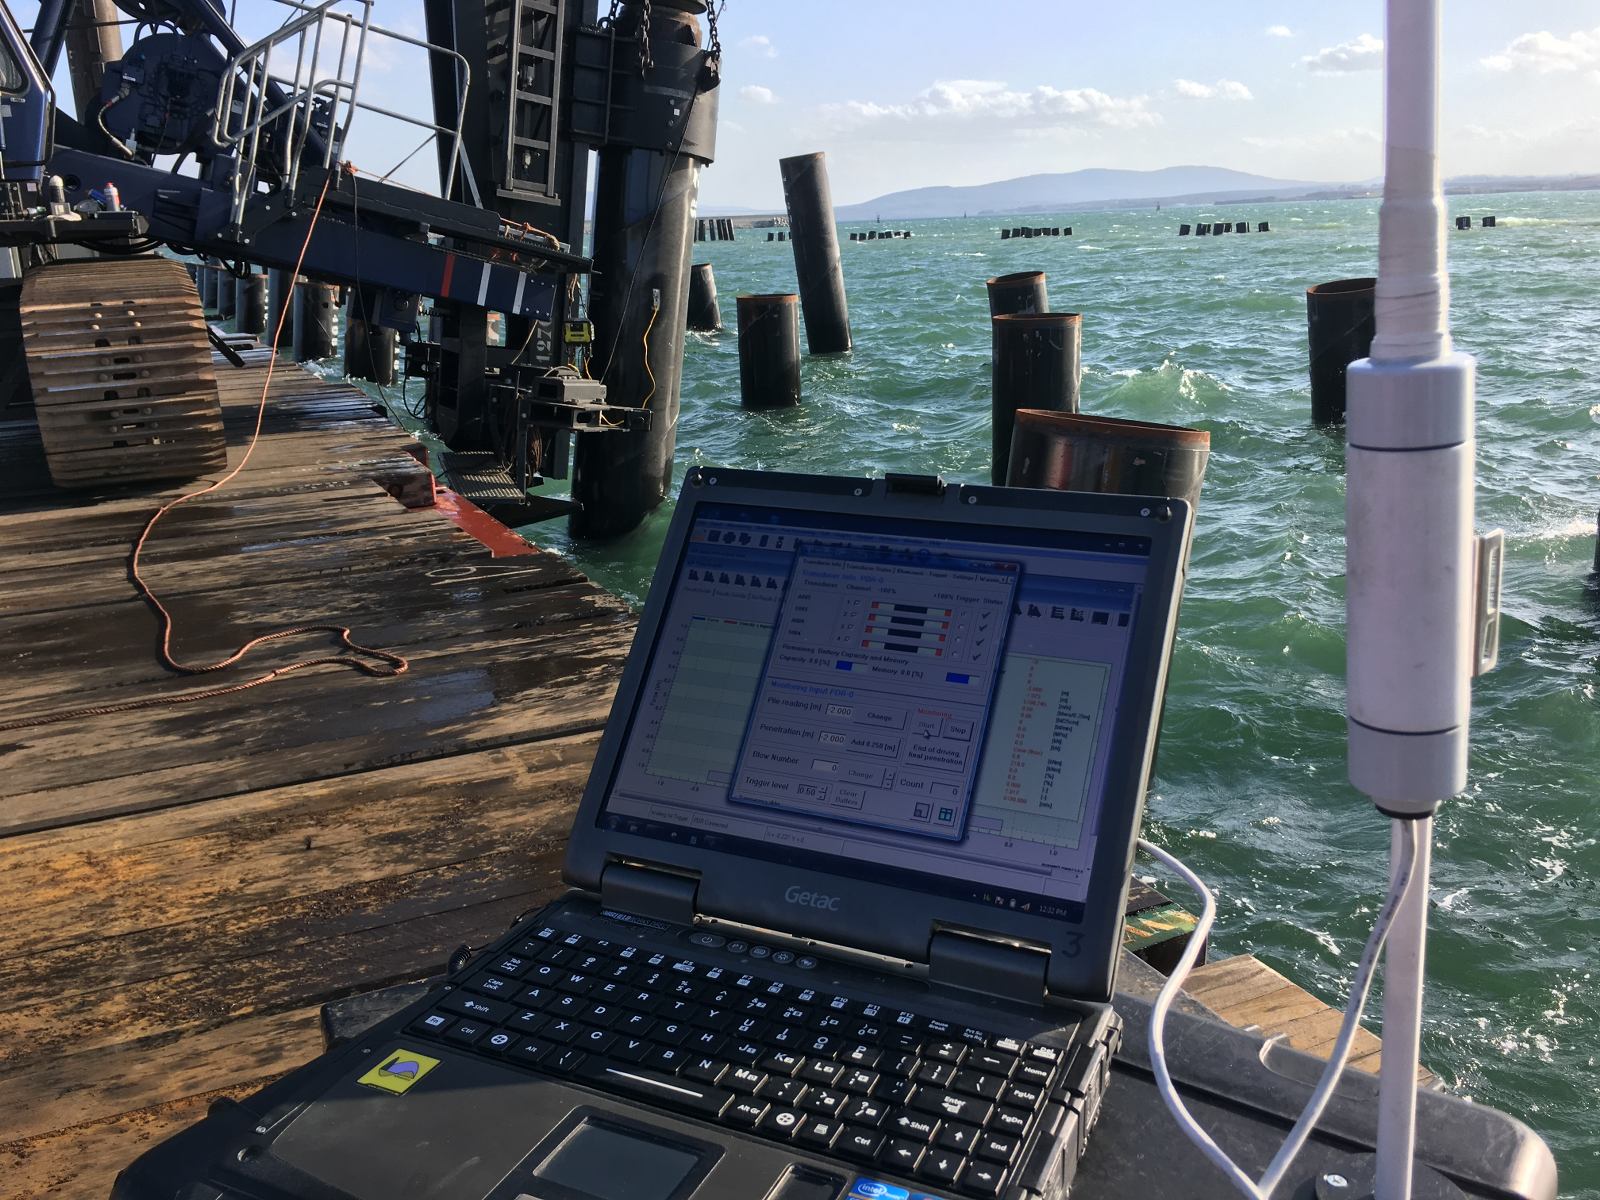
Signal matching works by comparing a calculated pile response against a measured pile response and then adjusting the soil model iteratively until the two align. During Dynamic Load Testing, strain and acceleration are measured near the pile head. From those measurements, force and velocity are derived. The measured force is then applied as a boundary condition in a wave-equation model, and the model calculates how the pile should respond. Where the calculated response deviates from the measured response, soil parameters are adjusted and the calculation is repeated until a good match is achieved.
Because pile properties such as geometry, material stiffness, and cross-section are relatively well known before the analysis begins, differences between the calculated and measured signals are attributed primarily to the soil model rather than to the pile itself. This makes the soil the main variable being solved for. Once a satisfactory match is reached, the static and dynamic contributions of shaft friction and toe resistance can be separated, and the sum of the static contributions gives the calculated static pile bearing capacity.
It is worth noting that signal matching is not a fully unique inverse solution. Different combinations of soil parameters can produce similar-looking signals. That is why engineering judgment, sensitivity analysis, and independent validation remain part of any credible signal matching exercise rather than optional extras.
What soil parameters does signal matching extract?
Signal matching extracts the dynamic and static components of shaft friction and toe resistance along the pile. More specifically, it allows the analyst to separate the total resistance measured during driving into its static and dynamic parts, and to distribute those parts along the pile shaft and at the pile toe.
The parameters refined through the matching process typically include:
- Static shaft resistance distributed along the pile length, layer by layer
- Static toe resistance at the pile tip
- Dynamic damping coefficients for both shaft and toe, which govern velocity-dependent resistance
- Soil quake values, representing the elastic deformation of the soil before permanent displacement occurs
- Remoulding and set-up behavior, inferred when restrike measurements are compared against end-of-driving measurements
These parameters feed directly into the soil model used for wave-equation analysis. A soil model calibrated through signal matching is grounded in actual pile behavior rather than relying solely on CPT correlations or empirical formulas. That distinction matters when ground conditions are variable or when the initial soil model contains significant uncertainty.
How do signal matching results feed into a drivability study?
Signal matching results improve a drivability prediction by providing a back-analyzed, field-validated soil model that replaces or refines the initial model built from ground investigation data. Instead of relying entirely on assumed correlations between CPT data and soil resistance to driving, the updated model reflects how the soil actually behaved during installation.
Within the AllWave-PDP workflow, the connection between signal matching and drivability prediction follows a structured learning loop:
- Ground investigation data is used to build an initial soil model
- A drivability prediction is run using AllWave software to simulate blow count, pile stresses, and energy transfer across the full installation depth
- The pile is installed and monitored, with strain and acceleration recorded
- Signal matching is performed on the Dynamic Load Testing data to back-analyze the actual soil resistance
- The soil model is updated based on the matched parameters
- The updated model is compared against the original prediction to identify where assumptions were accurate and where they diverged
- Findings are added to an experience database to improve future predictions on similar projects
This cycle means that a deviation between prediction and reality is not simply an error to explain away. It is information that sharpens the next prediction. A drivability model that can be updated in this way is far more valuable than one that produces a single nominal blow-count curve with no mechanism for refinement.
The same principle applies to vibratory driving. When a pile is installed with a vibratory hammer and then driven to final depth with an impact hammer, as in the NAM L13-F1-1 case involving a 4.5-meter-diameter monopile, the installation itself becomes a calibration experiment. Signal matching at Beginning of Restrike and End of Restrike, combined with the vibratory monitoring data, allows comparison between the original CPT-based model and the back-analyzed model, providing a much more complete picture of both drivability and capacity.
When should signal matching be performed during a project?
Signal matching should be performed as early in the installation program as possible, ideally on the first pile or a dedicated test pile, so that the updated soil model can inform the remaining installation work. Performing it only after all piles are driven eliminates the opportunity to adjust hammer selection, driving criteria, or installation strategy based on what the data reveals.
There are several points in a project where signal matching adds the most value:
- During or immediately after the first production pile installation, to validate the drivability prediction against real behavior before committing to the full program
- At Beginning of Restrike, to assess how soil resistance has changed after a rest period, capturing set-up effects that the initial model may not have predicted accurately
- At End of Restrike, to confirm long-term static capacity and compare it against the prediction
- When unexpected behavior occurs, such as early refusal, unexpectedly low blow counts, or pile stress anomalies, where the signal matching back-analysis helps diagnose the cause
- After vibratory pre-installation, when an impact hammer takes over, to reconcile the soil model derived from vibratory monitoring with the impact-based signal matching results
Performing signal matching at multiple stages within the same project, rather than as a one-time exercise, gives the most complete picture of how soil resistance evolves through installation and rest.
What are the limitations of signal matching for drivability predictions?
The most important limitation of signal matching is that it is not a unique inverse solution. Different combinations of soil parameters can produce a calculated signal that matches the measured signal equally well. This means the matched parameters are not automatically the correct physical representation of the soil, even when the visual fit looks convincing.
Other limitations that affect how signal matching results translate into drivability predictions include:
- Uncertainty in dynamic parameters: Damping coefficients and quake values are difficult to determine independently, and the matched values may compensate for errors elsewhere in the model
- Layer boundary uncertainty: Signal matching distributes resistance along the pile, but the exact depth of soil layer transitions may remain ambiguous, particularly in variable ground conditions
- Remoulding and resistance change: Soil resistance during driving differs from long-term static capacity due to remoulding, pore pressure changes, and set-up. Signal matching captures resistance at the moment of measurement, not necessarily the final static capacity
- Velocity and rate effects: Dynamic resistance components are velocity-dependent, and separating them cleanly from static resistance requires careful model calibration
- Hammer efficiency and cushion behavior: If the hammer model or cushion properties are not accurately defined, the signal matching process may compensate by adjusting soil parameters in ways that do not reflect actual ground conditions
- Local impedance changes: Variations in pile cross-section or material properties can produce signal features that are mistakenly attributed to soil resistance
For these reasons, a sensitivity analysis is technically more informative than a single matched result. Running the model across a realistic range of parameter combinations shows which conclusions remain stable and which depend heavily on assumptions that carry uncertainty. Signal matching is a powerful tool for improving a drivability prediction, but it works best when combined with engineering judgment, independent validation, and a systematic comparison between predicted and measured behavior.
How Allnamics Supports Signal Matching and Drivability Prediction
We integrate signal matching directly into our drivability workflow, treating it as a feedback mechanism rather than a standalone analysis. Our approach connects ground investigation, wave-equation modeling, installation monitoring, and back-analysis into a continuous learning loop that improves prediction accuracy across a project and across projects over time.
Specifically, we support your team with:
- AllWave-DLT signal matching for impact-driven piles, using field measurements of force and velocity to back-analyze shaft and toe resistance layer by layer
- AllWave-PDP drivability predictions that simulate blow count, pile stresses, energy transfer, and penetration resistance across the full installation depth, with explicit assumptions and uncertainty ranges
- Vibratory Driving Prediction (AllWave-VDP) for piles installed with vibratory hammers, including post-analysis and soil model refinement based on monitored installation data
- Installation monitoring during driving to capture the real-time data that makes signal matching possible
- Sensitivity analysis to show which prediction outcomes are robust and which depend on parameters that carry meaningful uncertainty
- Experience database integration, so that matched soil models from completed projects inform the starting assumptions for future predictions in similar ground conditions
Whether you are planning a first-of-kind offshore installation, managing risk on a large foundation program, or trying to understand why a pile behaved differently from the prediction, signal matching combined with a structured drivability workflow gives you the clearest possible picture of what the ground is doing. Contact us to discuss how we can support your project.
Related Articles
- What is the difference between static and dynamic soil resistance during pile driving?
- What is the difference between StatNamic and StatRapid?
- Can Rapid Load Testing replace Dynamic Load Testing?
- Is the Rapid Load testing better than Static Load testing?
- Is there a Rapid Load Testing code for the United Kingdom?