

A drivability prediction supports pile fatigue analysis by generating the stress history that each pile cross-section experiences during installation: blow by blow, depth by depth. The stress amplitudes, number of cycles, and tension-compression patterns produced by tools such as AllWave-PDP feed directly into fatigue damage calculations, giving engineers a quantified picture of cumulative damage before a single pile is driven. The sections below work through the most common questions engineers raise when connecting drivability predictions to fatigue assessment.
What data does a drivability prediction produce that is relevant to fatigue?
A drivability prediction produces the complete stress history at every depth increment during pile installation. The outputs that matter most for fatigue analysis are the maximum compressive stress, the maximum tensile stress, the blow count per meter (which translates directly into cycle count), and the transferred energy per blow. Together, these four outputs define the stress range and the number of loading cycles at each cross-section of the pile.
In practice, AllWave-PDP, the impact driving module within the AllWave software package, calculates the coupled hammer-pile-soil response at each penetration step. For every step, it records the peak compressive and tensile stresses along the full pile length, the permanent set per blow, and the energy transferred from hammer to pile head. When you multiply the blow count per meter by the stress range at a given cross-section, you obtain the cycle count and amplitude pair that fatigue standards such as DNV-ST-0126 or EN 1993-1-9 require as input.
Friction fatigue in the soil model adds another layer of relevance. As the pile penetrates deeper, the shaft resistance above the pile tip degrades over repeated loading cycles, a phenomenon the Alm and Hamre model captures explicitly. This degradation changes the stress distribution along the pile with depth, meaning that upper sections of a long pile accumulate a different stress history than sections near the tip. A drivability prediction that accounts for friction fatigue therefore produces a spatially resolved stress history, not a single worst-case value applied uniformly.
How is pile fatigue damage calculated during installation?
Pile fatigue damage during installation is calculated using a Palmgren-Miner linear damage accumulation rule. For each depth increment, you take the stress range (the difference between maximum compressive and maximum tensile stress per blow), identify the corresponding allowable cycle count from the pile material’s S-N curve, and divide the actual cycle count by that allowable. Summing these ratios across all depth increments gives the total accumulated damage ratio D, where D = 1 signals fatigue failure.
The drivability prediction provides the input: stress range per blow and blow count per meter. Your structural team then maps those values onto the appropriate S-N curve for the pile material and weld class. For steel tubular piles, the weld detail at the pile tip, at section transitions, and at any add-on welds typically governs because these locations combine stress concentration with the highest cycle counts.
One practical complication is that the stress range is not constant. Early in driving, when the pile is short and soil resistance is low, tensile stresses can dominate. At greater penetration, compressive stresses typically increase as soil resistance builds. A reliable fatigue calculation therefore requires the full depth-resolved stress history from the drivability prediction, not just the peak values at final penetration.
Which pile types and materials are most vulnerable to fatigue during driving?
Large-diameter open steel tubular piles, the monopiles and jacket piles used in offshore wind and oil and gas foundations, are the most vulnerable to installation fatigue. Their combination of thin walls relative to diameter, long driven lengths, and high blow counts per meter creates large numbers of high-amplitude stress cycles. Welded sections, add-on welds, and pile tip reinforcements are the locations where fatigue damage concentrates.
Concrete piles present a different vulnerability profile. Tensile stresses during driving are the primary concern because concrete has low tensile strength. A drivability prediction that shows tensile stresses approaching or exceeding the pile’s tensile capacity, particularly in prestressed concrete piles where the prestress level sets the effective tensile limit, signals a high risk of cracking during installation.
Composite piles and piles with mechanical splices introduce local stress concentrations at joints. Each splice acts as a potential fatigue initiation site, and the drivability prediction must resolve stresses at those specific locations rather than relying on average values across a pile segment.
What driving conditions increase fatigue risk the most?
The driving conditions that increase fatigue risk most are high blow counts combined with large stress ranges. This combination typically occurs when soil resistance is high relative to hammer energy, forcing the hammer to deliver many blows per meter of penetration while the pile experiences near-limit compressive and tensile stresses with each blow.
Several specific conditions amplify this risk:
- Hard intermediate layers: A dense sand or gravel layer encountered before the target penetration depth forces high blow counts through a zone the pile must pass. The pile accumulates significant fatigue damage in this zone even though it is not the final bearing layer.
- Undersized hammers: A hammer that is too small for the pile and soil combination produces low energy transfer per blow, requiring more blows to achieve the same penetration. More blows means more cycles at the same stress range.
- Tension wave reflection: In soft soils or when driving through water, the stress wave can reflect as a tension wave from the pile tip. If the pile is long and the soil resistance at the tip is low, this reflected tension wave can cause tensile stresses that exceed those seen in typical compression-dominated driving.
- Restrike after set-up: When a pile is redriven after a rest period, soil set-up increases resistance sharply. The first blows of a restrike can generate stress peaks significantly higher than those seen during initial driving, adding a concentrated burst of fatigue damage.
Vibratory driving introduces a different fatigue mechanism. At frequencies of 20 to 30 Hz, a vibratory hammer can produce thousands of stress cycles in a matter of minutes. Soil fatigue, the degradation of shaft resistance under repeated vibratory loading, changes the stress distribution along the pile continuously during installation. An AllWave-VDP vibratory driving prediction models this cycle-dependent resistance degradation, allowing you to estimate the cumulative stress cycles the pile experiences under vibratory conditions.
How can drivability predictions be used to optimize hammer selection for fatigue?
You can use a drivability prediction to compare hammer options before mobilization, selecting the combination of stroke, ram weight, and energy that minimizes fatigue damage while still achieving target penetration. The goal is to find a hammer that keeps blow counts low enough to limit cycle count while keeping stress ranges within acceptable limits, two objectives that can pull in opposite directions.
A larger hammer delivers more energy per blow, which typically reduces blow count and therefore reduces the total number of stress cycles. However, higher energy per blow also increases peak stress per cycle. The drivability prediction lets you quantify this trade-off explicitly for your specific pile geometry, soil profile, and structural stress limits.
A practical optimization workflow looks like this:
- Run the drivability prediction for two or three candidate hammers across the full soil profile.
- Extract the blow count per meter and the peak compressive and tensile stresses at each depth for each hammer option.
- Calculate the cumulative fatigue damage ratio D for each hammer option using the pile’s S-N curve.
- Identify the hammer that produces the lowest D while keeping stresses within structural limits and blow counts within practical installation rates.
- Run a sensitivity analysis on soil resistance uncertainty to confirm that the preferred hammer remains acceptable under realistic upper-bound soil conditions.
Stroke control is another lever the prediction reveals. Many hydraulic hammers allow variable stroke settings. A lower stroke reduces peak stress per blow but increases blow count. The drivability prediction can map out the stroke setting that minimizes total fatigue damage for a given soil layer, which is particularly useful when driving through hard intermediate layers where fatigue risk peaks.
What is the relationship between drivability fatigue and in-service fatigue life?
Installation fatigue and in-service fatigue act on the same pile and accumulate on the same S-N damage budget. If installation consumes a significant portion of the pile’s fatigue life, the remaining capacity available for in-service loading (wave action, current, operational loads) is reduced by exactly that amount. The total damage ratio D must stay below 1.0 across the combined installation and service life.
For offshore wind monopiles, this relationship is particularly important. The pile must survive decades of cyclic environmental loading after installation, and the S-N curves used for design already incorporate safety factors calibrated to that long service life. Installation fatigue that was not accounted for in the original design effectively erodes those safety margins.
The connection works in both directions. A drivability prediction that shows high installation fatigue damage may prompt a redesign of the pile wall thickness or weld class, changes that also benefit in-service performance. Conversely, a structural fatigue assessment that identifies a governing weld detail for in-service loading should flag that same detail for scrutiny in the drivability prediction, because it is likely to be the location where installation fatigue damage is also highest.
Post-installation signal matching and back-analysis close the loop. When measured driving records from installation monitoring are compared against the drivability prediction, any discrepancy in blow count or stress levels can be used to update the soil model and recalculate the actual fatigue damage accumulated during driving. This updated figure then feeds into the in-service fatigue assessment as a more accurate starting point than the pre-installation prediction alone.
How We Support Drivability and Fatigue Analysis
We combine advanced wave equation modelling, soil modelling expertise, and decades of installation monitoring experience to give your team a complete picture of pile fatigue risk, from the first prediction through to post-installation validation.
Here is what we offer in this area:
- AllWave-PDP and AllWave-VDP drivability studies: We run impact and vibratory driving predictions that produce the depth-resolved stress histories, blow counts, and energy transfer data your fatigue calculations require.
- Friction fatigue and soil modelling: Our soil models incorporate friction degradation effects, giving you realistic shaft resistance profiles rather than conservative uniform assumptions that can either overestimate or underestimate fatigue damage.
- Hammer selection optimization: We compare candidate hammer configurations and stroke settings to identify the option that minimizes cumulative fatigue damage while meeting installation productivity targets.
- Sensitivity analysis: We quantify how uncertainty in soil resistance, hammer efficiency, and cushion behaviour affects predicted stress ranges and cycle counts, so your fatigue assessment reflects realistic bounds rather than a single nominal run.
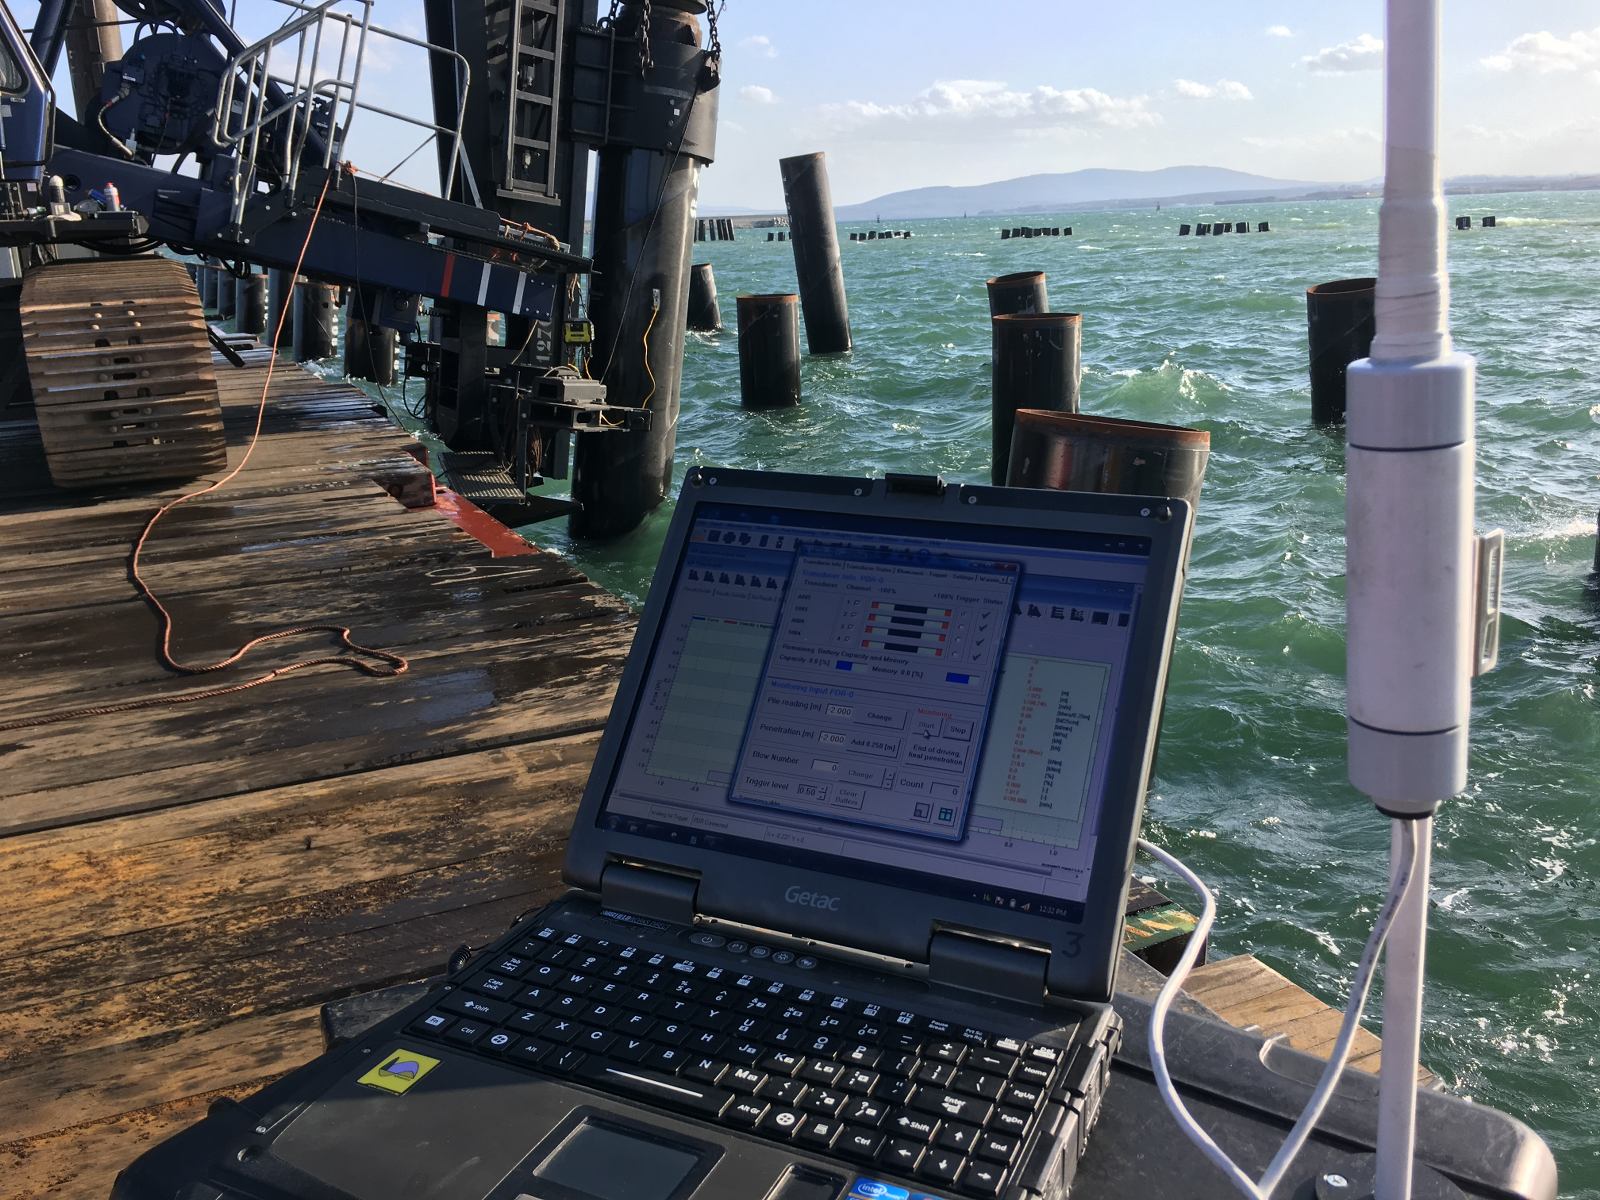
- Installation monitoring and back-analysis: We monitor driving in real time and perform signal matching post-installation to verify the actual stress history against the prediction, updating the fatigue damage estimate with measured data.
- Integration with in-service fatigue assessment: We support your structural team in combining installation fatigue damage with in-service loading to produce a complete lifetime fatigue budget for the pile.
If your project involves large-diameter steel piles, offshore foundations, or any installation scenario where fatigue risk is a design concern, contact us to discuss how a drivability prediction can be structured to directly support your fatigue analysis.