

Hammer efficiency directly affects a drivability prediction by determining how much of the hammer’s rated energy actually reaches the pile head as a stress wave. A lower efficiency means less energy is transferred, which produces a higher predicted blow count, or, in the worst case, a prediction of refusal at a depth the pile could realistically reach with a better-performing hammer. Because efficiency sits at the very start of the energy chain, even a modest error in this input propagates through every calculated output: blow count, pile stresses, penetration rate, and installation time.
The sections below work through the mechanics of hammer efficiency, its role in drivability predictions, the values commonly used in practice, and how measured data from the field can sharpen your assumptions before and during installation.
What factors determine hammer efficiency in pile driving?
Hammer efficiency in pile driving is the ratio of the energy actually delivered to the pile system to the hammer’s theoretical rated energy. It is determined by a combination of mechanical losses within the hammer itself, energy losses in the transmission path between hammer and pile, and the operating conditions on site. No hammer delivers 100% of its rated energy; losses are always present.
For impact hammers, the main factors include:
- Ram weight and drop height: The theoretical potential energy is ram weight multiplied by drop height. Any deviation from the nominal drop height reduces the energy available at impact.
- Friction and mechanical losses: Guides, seals, and moving parts all absorb energy before the ram strikes the anvil or pile cap.
- Diesel hammer combustion: In diesel hammers, combustion adds energy to the blow, but the actual contribution depends on fuel injection, compression ratio, and the stiffness of the pile-soil system. A stiffer system can produce a different combustion response than a softer one, meaning the hammer’s output is not independent of what it is driving into.
- Cushion and helmet condition: The helmet, cap plate, and cushion material between hammer and pile absorb and redistribute energy. A worn or compressed cushion transfers energy less efficiently and changes the shape of the force pulse reaching the pile.
- Alignment and eccentricity: Off-center blows waste energy through lateral movement and increase the risk of uneven stress distribution across the pile cross-section.
For vibratory hammers, efficiency is governed by different mechanisms: the eccentric moment, operating frequency, clamping force, and the degree to which the vibration frequency matches the resonant response of the pile-soil system. These factors are addressed separately in AllWave-VDP, which models vibratory driving as a distinct physical process.
How does hammer efficiency translate into energy transfer to the pile?
Hammer efficiency translates into energy transfer by setting the magnitude of the stress wave that enters the pile at the moment of impact. The energy that actually propagates down the pile as a compressive wave is the product of the hammer’s rated energy and its efficiency factor. This transferred energy then drives the pile against soil resistance, generating permanent penetration per blow.
The relationship follows the core principle of stress-wave analysis: hammer impact generates a stress wave, that wave propagates through the pile, interacts with the soil along the shaft and at the toe, and the reflected waves return to the pile head. The amplitude and duration of the initial wave are directly controlled by how much energy entered the pile in the first place.
In practical terms, if a hammer is rated at 500 kJ but operates at 70% efficiency, only 350 kJ enters the pile system. The blow count required to achieve a given penetration increases accordingly, because each blow delivers less work against soil resistance. At the same time, lower transferred energy means lower compressive stresses in the pile, which is not always a disadvantage, since overstressing the pile is a real failure mode that a drivability analysis must also guard against.
This is why hammer efficiency and pile stress limits are evaluated together in a complete drivability study. The goal is an operating window where transferred energy is sufficient to overcome soil resistance at all penetration levels, while compression and tension stresses remain within the pile’s structural limits throughout the entire installation process.
Why does an incorrect efficiency assumption skew drivability predictions?
An incorrect efficiency assumption skews drivability predictions because efficiency is a multiplier applied to every energy-dependent output in the model. Overestimate efficiency and the model predicts easier driving than will occur in the field, potentially missing a refusal risk. Underestimate it and the model predicts unnecessarily high blow counts, which can lead to over-specifying the hammer or raising unfounded concerns about pile fatigue.
The error compounds across the full installation profile. A drivability prediction calculates blow count, penetration rate, stress levels, and energy transfer at every depth increment from the start of driving to the target penetration. If the efficiency input is wrong at the beginning, every depth increment inherits that error. In layers with high soil resistance, where the margin between achievable penetration and refusal is already narrow, a 10 to 15% error in efficiency can shift the predicted outcome from successful installation to early refusal.
There is also an asymmetric risk. Early refusal triggered by an overly optimistic efficiency assumption can force costly remedial actions: switching to a larger hammer, removing soil or plug material, or adopting a different installation strategy. Some of these measures can damage the pile or alter its bearing capacity. An efficiency assumption that is too conservative, on the other hand, may lead to selecting a hammer that is unnecessarily large, which can cause excessive compressive stresses in the pile during driving through softer layers.
This is why a robust drivability study treats efficiency as an uncertain input and runs a sensitivity analysis across a realistic range of values, rather than relying on a single nominal run. The conclusions that hold across the full sensitivity range are the ones you can rely on for installation planning.
What efficiency values are typically used in drivability studies?
Drivability studies typically use hammer efficiency values in the range of 67% to 80% for hydraulic impact hammers, with diesel hammers often modeled at somewhat lower values depending on the combustion contribution and operating conditions. These are starting-point assumptions based on industry experience and hammer manufacturer data; they are not universal constants, and the appropriate value depends on the specific hammer model, its maintenance condition, and the pile-soil system being driven.
In practice, the following general guidance applies:
- Hydraulic hammers: Efficiency values of 0.70 to 0.80 are commonly used as a baseline, reflecting well-maintained equipment under typical offshore or onshore conditions.
- Diesel hammers: Efficiency is more variable because combustion adds energy in a way that depends on system response. Values are often modeled in the range of 0.60 to 0.80, with the combustion contribution treated separately.
- Drop hammers: Efficiency tends to be lower, often in the range of 0.55 to 0.70, due to guide friction and less precise control over drop height.
- Vibratory hammers: Efficiency is defined differently and is not directly comparable to impact hammer efficiency; it relates to the power delivered to the pile-soil system relative to the motor’s rated power input.
These values should always be treated as inputs to a sensitivity analysis rather than fixed parameters. The AllWave-PDP hammer library supports this by allowing you to vary efficiency across a defined range and observe how predicted blow count, stress levels, and refusal risk respond to those changes.
How can measured data improve hammer efficiency inputs?
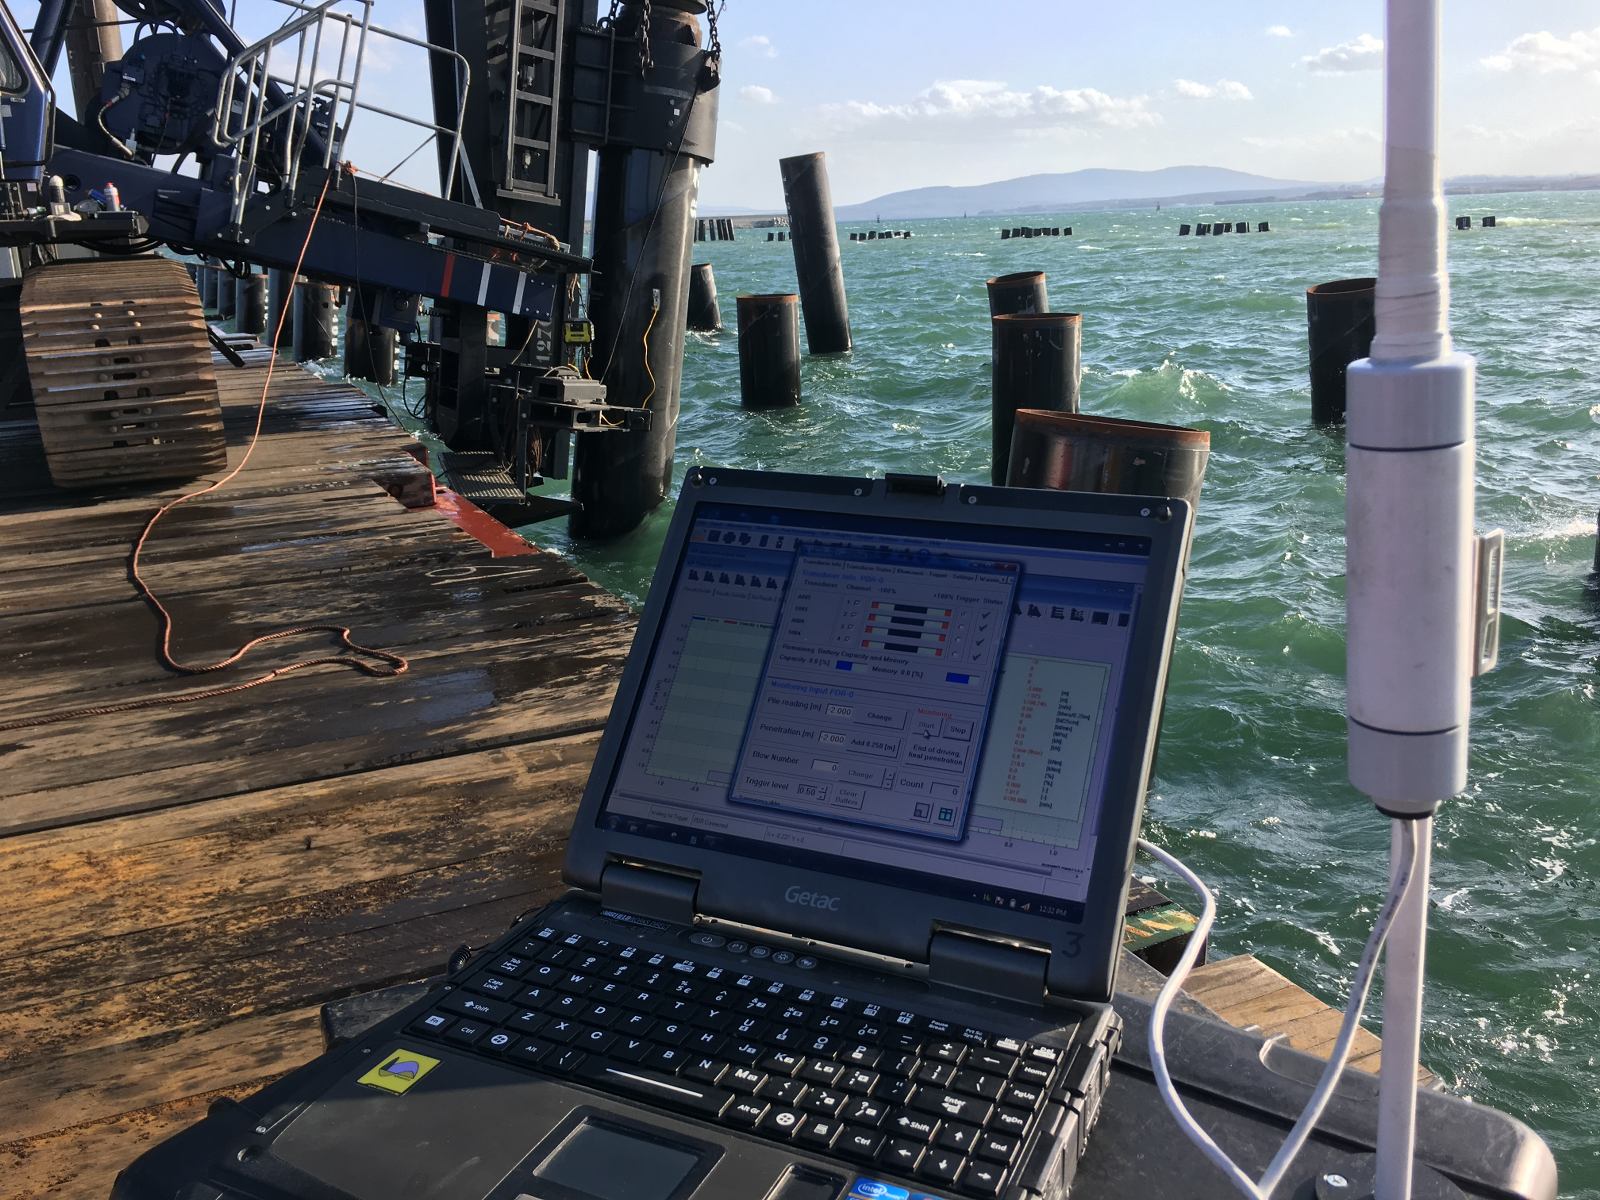
Measured data improves hammer efficiency inputs by replacing assumed values with values derived from actual hammer performance during driving. The most direct method is Pile Driving Analysis (PDA), which uses strain gauges and accelerometers near the pile head to measure the force and velocity of the stress wave entering the pile on each blow. From these measurements, the energy actually transferred to the pile can be calculated directly; this is the transferred energy, or EMX value, which can be compared against the hammer’s rated energy to back-calculate the actual efficiency.
This measured efficiency can then be fed back into the drivability model in two ways:
- Real-time adjustment: If PDA monitoring is running during the early stages of installation, measured efficiency values from the first meters of driving can update the model inputs before the pile reaches the critical high-resistance layers deeper in the profile.
- Back-analysis and model calibration: Comparing predicted blow count profiles against measured installation records, using the actual measured efficiency, allows systematic improvement of the model. Over time, this builds a database of hammer performance under different soil and operational conditions, which improves the quality of future predictions for similar projects.
Signal matching, where the measured force and velocity records are used to refine the soil resistance model, also indirectly improves efficiency inputs by separating the contribution of hammer performance from soil resistance in the observed driving response. The quality of a drivability prediction is ultimately bounded by the quality of its inputs, and measured data is the most reliable way to reduce uncertainty in the efficiency parameter.
When should hammer efficiency be re-evaluated during a project?
Hammer efficiency should be re-evaluated whenever the observed driving behavior deviates significantly from the predicted profile, when the hammer is changed or serviced, or when driving conditions change in a way that could alter the hammer’s operating point. Treating efficiency as a fixed value set at the start of a project and never revisited is one of the more common sources of avoidable prediction error.
Specific trigger points for re-evaluation include:
- Blow count deviating from prediction: If measured blow counts are consistently higher or lower than predicted across a soil layer where the resistance model is considered reliable, the efficiency assumption is a likely source of the discrepancy.
- Hammer replacement or substitution: Switching to a different hammer model, even one with the same rated energy, requires revisiting the efficiency input because mechanical characteristics differ between manufacturers and models.
- Hammer maintenance or repair: A hammer that has been serviced, had seals replaced, or had its cushion material changed will perform differently than before. Post-maintenance efficiency should not be assumed equal to pre-maintenance values.
- Driving into significantly different soil conditions: For diesel hammers in particular, the combustion response changes with soil stiffness. Driving through a very dense layer after a softer one can shift the hammer’s operating point and alter its effective efficiency.
- Early refusal or unexpectedly easy driving: Both outcomes warrant checking whether the efficiency assumption is consistent with what PDA measurements show for transferred energy.
Re-evaluation does not always require new field measurements; sometimes a review of the existing PDA data or a comparison of blow count records against the sensitivity analysis range is sufficient to determine whether the original efficiency assumption remains defensible.
How We Support Drivability Predictions at Allnamics
We integrate hammer efficiency analysis directly into our drivability studies, treating it as an uncertain input that requires explicit sensitivity analysis rather than a fixed assumption. Our approach covers the full coupled system (hammer, helmet and cushion, pile, and soil) so that efficiency is evaluated in the context of the actual pile-soil interaction, not in isolation.
Here is what we provide in practice:
- Drivability studies using AllWave-PDP: We simulate impact driving across the full installation profile, predicting blow count, penetration rate, transferred energy, and compression and tension stresses at every depth increment. Hammer efficiency is varied across a realistic range to identify which conclusions are robust and which depend on assumptions that need field verification.
- Vibratory driving prediction using AllWave-VDP: For vibro-driven piles, we model the distinct physics of vibratory installation, including the frequency-dependent interaction between hammer, pile, and soil.
- PDA monitoring and back-analysis: We measure actual transferred energy during installation, compare it against the predicted efficiency, and update the model where the data supports a revision. This closes the loop between prediction and reality.
- Sensitivity analysis as standard practice: We do not deliver a single nominal run. Every drivability study we produce includes a sensitivity analysis across key uncertain inputs, including hammer efficiency, so your team understands the range of possible outcomes before installation begins.
- Hammer selection support: We help you identify the operating window where a given hammer delivers sufficient energy to overcome soil resistance without exceeding the pile’s structural stress limits, at all penetration levels, not just at the target depth.
You can learn more about the software behind our drivability studies on the AllWave Software Package page. If you want to discuss a specific project or get a drivability study underway, contact our team directly and we will respond with a concrete proposal.