

CPT data is used for drivability prediction by translating cone resistance (qc) and sleeve friction (fs) values directly into a layered soil resistance model, which then drives wave equation calculations that simulate pile installation blow by blow. The more directly CPT measurements feed into the soil model, the less interpretation error enters the prediction. The sections below unpack how this works in practice, from soil model construction to software tools and when to update your prediction during a project.
How is CPT data converted into soil resistance for pile driving?
CPT data is converted into soil resistance for pile driving by mapping cone resistance (qc) and sleeve friction (fs) values to unit shaft friction and unit toe resistance at each depth increment, producing a layered Soil Resistance to Driving (SRD) profile. This profile forms the foundation of any drivability study and replaces the need to derive intermediate parameters such as undrained shear strength, which introduces subjective interpretation.
The conversion follows established CPT-based methods. One of the most widely used approaches in offshore practice is the Alm and Hamre method, which was developed specifically to reduce the uncertainty caused by human interpretation of derived soil parameters. By linking drivability parameters more directly to measured CPT values, the method reduces the number of interpretation steps between raw data and the soil model.
Beyond the static capacity profile, the conversion also assigns dynamic soil parameters to each layer, including shaft and toe damping coefficients and quake values. These parameters govern how the soil responds to rapid loading during pile driving and are not directly measured by a CPT, so they are typically assigned based on soil classification derived from the CPT friction ratio (Rf) and correlated to soil type.
A key concept in this conversion is friction fatigue, the reduction in unit shaft friction at a given depth as the pile tip advances deeper. CPT-based methods account for this by applying a depth-dependent reduction factor to the shaft resistance above the pile tip, reflecting the remoulding and stress relief that occurs as the pile passes through a layer.
What is a drivability study and what does it predict?
A drivability study is a wave equation analysis that simulates the full pile installation process, predicting how a specific pile, hammer, and soil combination will perform at every depth increment from start to final penetration. It answers two questions simultaneously: can the available installation equipment overcome the soil resistance, and will the pile remain structurally sound throughout driving?
The study produces a set of predicted outputs as a function of penetration depth, including:
- Blow count or blow rate (blows per metre or blows per minute for vibratory driving)
- Maximum compressive and tensile stresses in the pile
- Energy transferred from hammer to pile
- Hammer efficiency and ram velocity
- Total, shaft, and toe resistance at each depth
- Pile set per blow and cumulative penetration
For concrete piles, the study can also track stresses in reinforcement and the potential for crack development. For steel piles, fatigue accumulation during long driving sequences may be relevant.
Critically, a drivability study is not just a pass/fail check. It identifies critical depths where refusal risk is high, where tensile stresses peak during driving through soft layers beneath hard ones, or where energy transfer drops due to cushion or soil behaviour. This makes it a risk management tool as much as a performance prediction tool.
Which CPT parameters matter most for drivability accuracy?
The parameters that matter most for drivability accuracy are cone resistance (qc) for toe resistance estimation, sleeve friction (fs) for unit shaft friction, and the friction ratio (Rf) for soil classification. The quality and vertical resolution of the qc profile are the single largest driver of prediction accuracy because they control both the SRD profile and the identification of layer boundaries.
Layer boundaries deserve particular attention. A thin hard layer, a dense sand lens within soft clay, or a transition from clay to dense sand can each trigger early refusal or cause a sudden spike in compressive stress. If the CPT resolution is too coarse, or if the CPT does not reach the target depth, these features may be missed entirely.
Uncertainty in the CPT-to-SRD conversion also comes from the dynamic parameters that cannot be read directly from the CPT. Damping values and quake values are assigned by correlation, and their influence on blow count predictions is significant. This is why sensitivity analyses on these parameters are more informative than a single nominal prediction run. A robust drivability study shows which conclusions hold across a realistic range of input values, not just at the best-estimate values.
How does pile type and geometry affect the CPT-based prediction?
Pile type and geometry affect the CPT-based prediction because they determine the active surface area for shaft friction, the toe area for end bearing, and the mechanical impedance that controls how stress waves travel through the pile. A change in diameter, wall thickness, or pile material changes the predicted blow count, stress levels, and energy transfer, even with an identical soil model.
Open-ended versus closed-ended piles
For open-ended steel tubular piles, the effective toe resistance depends on whether the soil plug inside the pile moves with the pile (plugged behaviour) or remains stationary (unplugged or coring behaviour). CPT-based methods handle this differently depending on the assumed plug condition, and the transition between plugged and unplugged behaviour during driving adds uncertainty. Larger diameter piles are more likely to drive in a coring mode, which reduces toe resistance but also reduces the driving resistance that must be overcome.
Pile impedance and stress wave behaviour
Pile impedance, defined as the product of cross-sectional area, elastic modulus, and wave speed divided by wave velocity, governs how much of the hammer energy is transmitted into the soil versus reflected back up the pile. A pile with low impedance relative to the hammer will reflect more energy and show higher tensile stresses during driving. Changes in cross-section along the pile, such as a thicker wall at the toe or a splice, create impedance discontinuities that the wave equation model must represent accurately. This is why pile geometry is modelled segment by segment in tools like AllWave-PDP, not as a single uniform element.
What software and wave equation models are used in drivability analysis?
Drivability analysis uses wave equation software that models the hammer, pile, and soil as a coupled dynamic system and solves the stress wave propagation equations at each time step. The most established numerical approach is the Method of Characteristics, which solves the one-dimensional wave equation along characteristic lines and has been the backbone of pile driving simulation since the 1980s.
AllWave-PDP (Pile Driving Prediction) and AllWave-VDP (Vibratory Driving Prediction) are the tools developed and used for impact and vibratory driving simulations respectively. AllWave-PDP handles impact hammer driving and produces blow count, stress, and energy output as a function of depth. AllWave-VDP applies the same wave equation framework to vibratory hammers, where the excitation is a continuous sinusoidal force rather than a single impact, and the output is penetration rate rather than blow count.
Both tools require the same fundamental inputs: a pile model built from geometry and material properties, a hammer model describing ram mass, stroke, efficiency, and cushion characteristics, and a soil model derived from CPT or other ground investigation data. The difference lies in how the driving force is applied and how the soil resistance model handles the cyclic loading of vibratory driving versus the transient loading of impact driving.
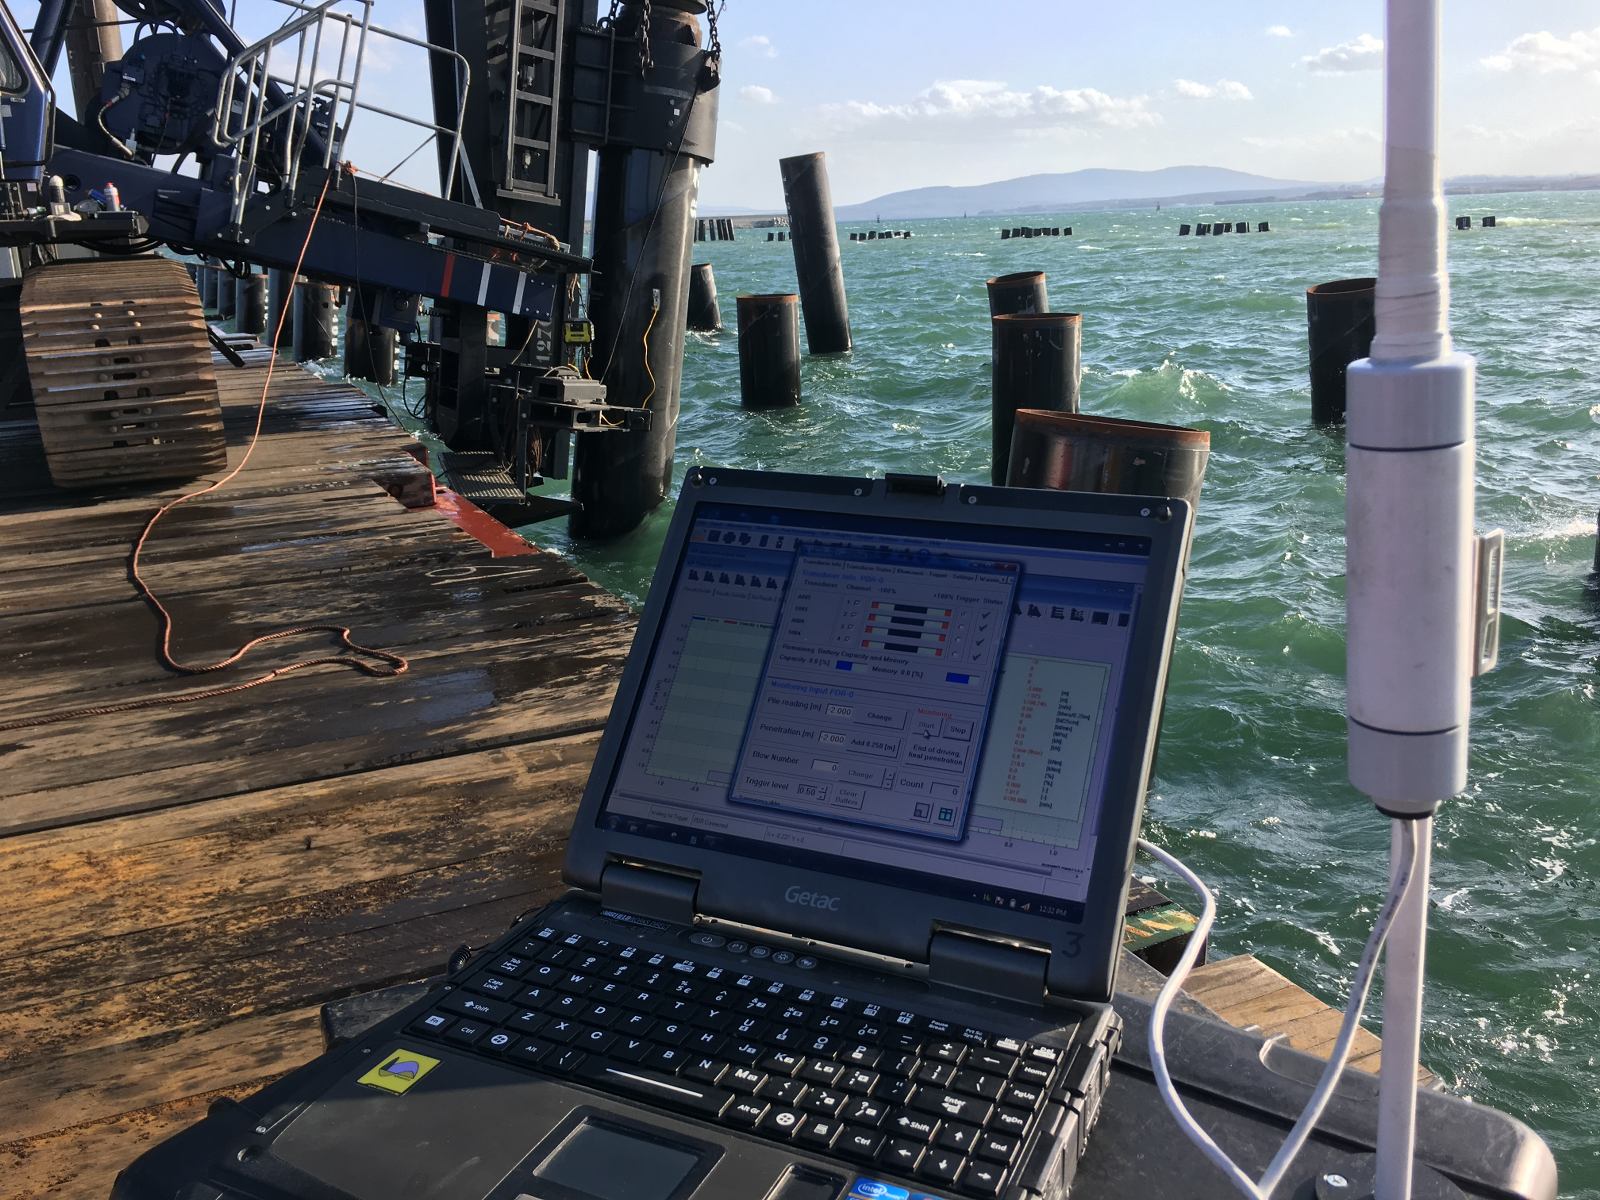
Signal matching, performed with AllWave-DLT during or after installation, uses measured force and velocity records from instrumented piles to back-calculate the actual soil resistance. This back-analysis produces an updated soil model that can be compared directly with the pre-installation prediction, closing the learning loop.
When should CPT-based drivability predictions be updated during a project?
CPT-based drivability predictions should be updated whenever new data becomes available that changes the soil model, the hammer performance assumptions, or the pile geometry, and always after the first pile installation on a site provides measured driving records. A prediction made before installation is a starting model, not a fixed answer.
The most valuable update point is after the first instrumented pile. Measured force and velocity data from dynamic load testing during driving allow signal matching back-analysis, which reveals the actual SRD profile and dynamic soil parameters. If the measured blow count or stress levels differ significantly from the prediction, the soil model should be recalibrated before driving the next pile.
Other triggers for updating the prediction include:
- New CPT data from additional boreholes closer to the pile location
- Observed early refusal or unexpectedly easy driving that suggests the SRD profile is wrong
- Hammer substitution when the planned hammer is replaced with a different model or size
- Design changes to pile length, diameter, or wall thickness
- Seasonal or tidal effects in soft soils where pore pressure changes affect resistance
The most powerful drivability workflow treats the prediction, installation monitoring, and back-analysis as a continuous learning loop. Each installation adds to an experience database that improves the accuracy of subsequent predictions on the same project and on future projects in similar ground conditions. A deviation between prediction and measurement is not just a problem to explain; it is data that makes the next prediction better.
How Allnamics Supports Your Drivability Prediction
We combine CPT-based soil modelling, wave equation simulation, and installation monitoring into an integrated drivability workflow that covers the full installation process, from pre-project prediction to post-installation back-analysis. Our approach is built on decades of experience with impact- and vibratory-driven piles, onshore and offshore, and is supported by our in-house AllWave software suite.
Here is what we provide in a drivability study:
- CPT-to-SRD soil model construction using direct CPT-based methods to minimise interpretation uncertainty
- Impact driving prediction with AllWave-PDP, producing blow count, compressive and tensile stresses, energy transfer, and hammer efficiency as a function of depth
- Vibratory driving prediction with AllWave-VDP, including penetration rate, soil resistance, and critical depth identification for vibratory hammer selection
- Sensitivity analyses on key soil and hammer parameters to quantify prediction uncertainty and identify risk zones
- Installation monitoring and signal matching during driving to validate the prediction and update the soil model in real time
- Back-analysis and post-diction after installation to close the learning loop and build your project experience database
- Independent technical review of existing drivability studies for projects where a second opinion is needed before mobilisation
Whether you are planning a new offshore wind foundation campaign, assessing refusal risk for a nearshore infrastructure project, or reviewing a contractor’s installation methodology, we can support your team with the technical depth the project requires. Contact us to discuss your drivability challenge.